Trend Window
Navigation: User Guide ➔ Windows ➔ Trend Window
| Application Window | Message Window | Graphics Window | Access Window | Explorer Window | Trend Window | Controls Window | TagList Window | Project Window |
|---|
Latest SysCAD Version: 13 May 2026 - SysCAD Build 139.37082
Related Links: Trend Commands, General Options Trends, Controls Window
Introduction
A Trend Window is an extremely useful tool for visualising and tracking model results. It is an optional document to display additional information. Deleting a Trend Window will not affect SysCAD project results. Some key advantages of Trend Windows:
- Have the Key Performance Indicators (KPIs) for a project visible in one window.
- Keep track of different variables from any flowsheet in a project.
- Graphically trend and visualise selected variables.
- Direct input of "Input" (white field) parameters.
- In a Steady State project the values in the Trend Window are displayed over a range of iterations. This allows visualisation of how variables across the project change as the solution moves towards convergence.
- In a Dynamic project the values in the Trend Window are displayed over a range of time. This allows for visualisation and interrogation of historical data for tags (e.g. how the level of a tank changes as a function of time).
- Variables from PID controllers may also be trended using the Controls Window. This is an extension of the normal trend window.
When a new project is created, SysCAD automatically adds a Trend window. Additional Trend windows may be added to the project, please see Open a New Trend Window for information. Trend windows are saved as files with the trn extension to a \DocsTrend folder within the project. Trend windows can be navigated to via the Explorer Window or the ![]() Recent Trend Window Hot Jump on the menu bar.
Recent Trend Window Hot Jump on the menu bar.
For a description of menu commands and toolbar buttons for the Trend window see Trend Commands. This describes commands for scrolling, zoom in/out, jump to end, various options, etc.
Video Link: The following video shows you how to add tags to the Trend Window and how to trend a tag:Trend Windows video
A Trend Window is split into two views. The top half displays the Trend Line View. The bottom half contains a list of tags is termed the Trend List View. The sizes of the two views may be adjusted by moving the splitter bar up and down (the horizontal grey bar between the views). An example of a Trend window is shown below:

NOTES:
- The vertical green line represents the most recent iteration (Steady State project) or the current time (Dynamic project). Use
 to jump to the end of time to ensure the most recent values are displayed on the Trend window. It is often required to jump to end again after zooming.
 - Each variable can have a different range in the y-axis, the variable range will fit the full plot area.
- If the trend line is switched on, it will add the variable to the Historian. However, if "Record in Historian" option is turned off, the trend lines are not remembered. If you then scroll or zoom in the Trend Line View, the trend lines are lost.
- If the Historian is on, new values will be added to the historian file until it is full, then a new file will be created. SysCAD will only keep a specified number of historian files, the older files will be discarded to make room for new ones. As a result, user may only access the more recent values in the Trend.
The mouse click options and Trend List View column headings are explained below. For information about the Trend Window commands, please see section SysCAD Commands - Trend Commands.
Open a New Trend Window
To open a new Trend window, use one of the following commands:
- If the 'Trend' menu is active (click on any Trend window), click on Trend - New Trend Window.
- Right click on 'Trends' in the Explorer Window (if this is not already open, click on View - Explorer) and select 'New Trend Window'.
- With a project open, use one of the following commands:
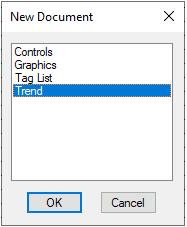
- Window - New Document
- Icon:

- Shortcut Key: Ctrl+N
- Select the 'Trend' option, and press 'OK'.
Each of these methods will open a new Trend Window 'Trend_xx.trn.'
Notes:
- This command is only available if a SysCAD project is open.
- This command is not available if SysCAD is solving or running.
- When the project is saved, the Trend windows are saved to the \DocsTrend folder.

Trend Line View
The Trend Line View is the top view area above the splitter bar. It is used to graphically display trends configured in the Trend List View below.
Trend Toolbar buttons: ![]() - Use these toolbar buttons to navigate the trend line view. For a detailed description of each command, refer to the Trend Commands section.
- Use these toolbar buttons to navigate the trend line view. For a detailed description of each command, refer to the Trend Commands section.
Display Changing Information along a Trend Line

|
Holding down the mouse button in the Trend Line generates a trend information pop up window. This contains the following information about a Trend line:
As you move the cursor across the Trend Window, the information displayed in the pop-up window changes as a function of number of iterations (steady state project) or of time (dynamic project). This also allows for interrogation of model values for the duration of the project solve time. mouse click If Left mouse button held down, the information displayed in the pop-up window is for the trend line that is closest to the cursor. As the cursor is moved along the Trend Line View, the cursor may move between Trend lines and hence display information for different tags. Shift + mouse click If <Shift> key + Left mouse button is held down, the information displayed in the pop-up window is for the trend line that is closest to the cursor. As the cursor is then moved along the Trend Line View, the displayed information will remain with the original tag. |
Configure a Trend Line

To make changes to a Trend Line, or the Trend Line View, Right Click on a trend line and the following pop-up list will be displayed:
- The first value is the Tag for the Trend line. Clicking this will open the Access Window for this unit will be displayed.
- The next 3 fields (Fit, Scale, Position) adjust the position of the selected trend line in the Trend Line View.
- If Auto On is selected the trend line is centred on the Trend Line View.
- Colours allows for changing the colour of the selected Trend Line or the colour of the Trend Line View background or Grid lines.
Zoom into a Selected Area
The user may zoom in on a selected portion of the trend by double clicking on either side of the area of interest. The window will then zoom to the area between the two locations. The duration display on the Trend Window will become the time difference between the two points.
Data Interpolation
The image below shows the trend window zoomed in to show 10 iterations or time steps.

- Red Line: Result tag values (grey field) are interpolated between points.
- Yellow Line: Input tag values (white field) are constant between points (flat horizontal lines).
Trend List View
The bottom half of the Trend Window is the Trend List View. This is used to enter user selected Tags for viewing. Values are updated each iteration. If required, these values can be trended in the Trend Line View by turning the trend line option on. The various configuration options are described in the sections below:
Viewing a Tag

Tag: Adding a Tag
The recommended method to add a Tag to the Trend View List is by "Send to Trend" or by using "Copy and Paste". User may also type the tag name and engineering unit into the Tag column. Please note that the engineering conversion unit is case sensitive.
- For example:
- Right click on a graphics symbol in the Graphics Window to open the Access Window.
- Select a variable on the Access Window by right clicking to bring up the pop up menu, select "Send to Trend" to add it to the trend window.
- When using "Send To Trend", the variable will be added to the most recently accessed trend window, on the first available line under the selected row. Therefore if you want to add the variable to a specific line on a specific trend window, first open the desired Trend Window, highlight the cell where the trend variable should go, then go to the access window and select the variable to send to trend.
- Alternatively, select a variable on the Access Window by left click, press <Ctrl + T> to copy, switch back to the Trend List View, highlight an empty row and press <Ctrl + V> to paste.
- Multiple tags can be copied by click and drag, hold shift and using arrow keys on the Access Window. To paste multiple tags, make sure at least an equivalent number of rows are highlighted on the Trend window.
If the tag is valid, its current value and default ranges will be shown. If the tag entry is not found, a message will appear in the Message Window.
Meas: This displays the current value of the tag. The measured value is being constantly updated as changes occur regardless of the historian and trend line status. However, if the entry is in the edit mode, the measured value will not be updated.
- Hint: If the value is an input field (can be changed by the user), indicated by a white box field, values may also be changed directly within the Trend Window.
Min: Represents the minimum value on the Trend Line View for that tag. If the value goes below the minimum, the trend line is drawn along the bottom of the Trend Line View.
Max: Represents the maximum value on the Trend Line View for that tag. If the value goes above the maximum, the trend line is drawn along the top of the Trend Line View.
Description: The tag description is placed here. This field is also used for Driver file tags.
Note: When information is copied from the trend window, the descriptions will not be copied. That is, the description is only available on the Trend List View for displaying purposes and is not associated with the model data.
Comport Icon: (e.g.: ![]() ) An indicator of a driver tag. Only available if drivers are used. (For more information, refer to SysCAD Marshal - Trending SysCAD Marshal Driver Tags.)
) An indicator of a driver tag. Only available if drivers are used. (For more information, refer to SysCAD Marshal - Trending SysCAD Marshal Driver Tags.)
General Comment: If the Trend Window values or trend lines do not refresh for any reason, either of the following actions may resolve the problem:
- Click on the refresh
 button to reconnect and refresh all tags.
 - Click on the scroll to end button to force the Trend Line Window to request points from the historian and repaint.
When the Trend Window is refreshed, the Trend Window requests information from the historian. A small dialog box on the bottom left of the main window will appear and indicate the progress of the requests to the historian.
Column Width:Dragging the column separation bar with the mouse can change the column width. (Similar to column resize in other Windows operation programs.)
- A text description may be entered instead of a tag by placing a ' at the start of the field.
Enabling or Disabling a Trend Line
|
A single Left Hand mouse click on the small square box to the left of the tag turns a trend line on or off. A short coloured line indicates the status of the trend line option. To switch off the trend line, simply click on the small square box again. By default, the tag is added to the historian for recording when the trend line is activated - this is indicated by the little yellow dot next to the trend line. The Trend line may be turned off, but the value may still be recorded in the Historian, as indicated by the yellow dot. |
Change the Colour of a Trend Line
A single Right click on the small square colour line box to the left of the tag name will display a dialog box that will allow selection of the colour of the trend line.
Change the Thickness of Trend Lines
Trend line thickness is a global setting in General Options Trends which is applies to all lines in all Trend windows.
Configure Tags and/or the Trend List View
A single right click anywhere along the tag entry row will display the following pop up menu (Note: The contents of the menu may vary according to row selected):

|
|
If the right mouse click is anywhere on the column-heading row, the following pop up menu is displayed. All the options available here are global options.

All options above are explained earlier with the exception of Trend Indicator.
- The Trend Indicator function will allow the user to locate a trended variable easily on the Trend Line View.
- To do so, select the Trend Indicator option, then rest the mouse cursor on a selected trended tag on the Trend List View, the trend line in the Trend Line View will blink to indicate its location.
- The user may first need to fit all the trends to ensure they are all visible.
- Some options such as the Trend Indicator are permanent options, they are not selectable.
Trend List Reference Tag Status Colour
Please see Access Field Reference Tag Status Colour.
Trend Dialog Boxes
General Options - Trend Window
Please see General Options Trends. Includes various options including displayed colours, grid lines, and line thickness.
Query Dialog Box

|
This dialog box is available from a button on the Trend Options Dialog Box and the Trend | Query menu option. This allows you to enter a request to the historian. The results are stored in the specified file. By default a list of all the trended tags (where the trend lines are switched on) for the current Trend Window is shown. The default list would generate a file representing the current Trend Line View. Only tags that are recorded by the historian will be reported by the query. Tags may be added and removed at will. A conversion unit may follow each tag. Note that the query will only accept tags that are currently being recorded by the historian. A number of options may be chosen to configure the report layout. The resulting report is in a comma-delimited file and may be imported into a spreadsheet package to draw graphs. |
Trend Examples
Example Trend Usage for Steady State Projects
- Add Feed Rates to the Trend page to allow easy change without having to right click on all the separate feeders or controllers.
- Add key process variables to the trend page to observe the change as input variables change.
This is an example trend window for the Tutorial project. As demonstrated, the trend window can become the project summary table displaying input and results.

Trending Run Speed and Processor Use
Add these tags to the Trend Window for dynamic projects to track run speed and processor usage:
- PlantModel.Stats.RunSpeed.Each (%)
- PlantModel.Stats.RunSpeed.Total (%)
- PlantModel.Stats.RunSpeed.Avg (%)
- PlantModel.Stats.ProcessorUse (%)
- PlantModel.Stats.ProcessorUseAvg (%)
- $Solver.Tears.Summary.Step.Iterations