Example - 02Feature Projects
Navigation: User Guide ➔ Example Projects ➔ 02 Features
Command Script Example
Project Location
This is a Steady State project and is stored at:
..\SysCADXXX\Examples\02 Features\Command Script Example.spf
Features Demonstrated
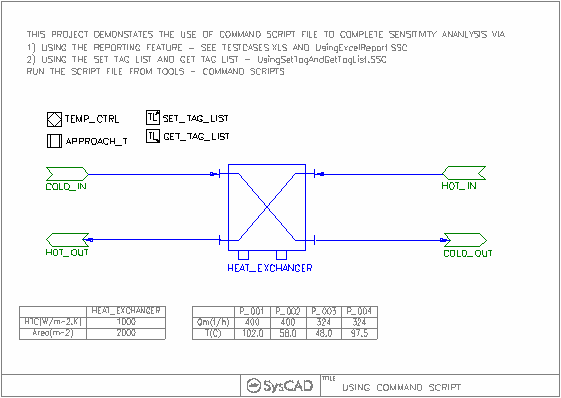
A simple project showing how to use command script file to complete sensitivity analysis.
- Shows the completion of sensitivity analysis via Excel reports.
- Shows the completion of sensitivity analysis via GetTagList and SetTagList.
Brief Functionality Work Flow
This project shows TWO different ways of completing the same task.
- (A) Using Command Script file with the Excel Report.
- Step 1: Create the SysCAD project, make sure the project is solved.
- Step 2: Set up an excel report for the sensitivity analysis. (Test Cases.xls)
- Step 3: Set up a command script file to include all the commands to run the sensitivity analysis. (UsingExcelReport.ssc)
- Step 4: Run the command script file using SysCAD command Tools | Command Scripts..., select UsingExcelReport.ssc and press execute.
- The advantage with using the Excel report is that the excel file can be set up with nice formatting, including charts for data analysis. The disadvantage with using the Excel report is that it can be quite slow especially when running a large number of cases.
- (B) Using Command Script file with the SetTagList and GetTagList.
- Step 1: Create the SysCAD project, make sure the project is solved.
- Step 2: Insert unit operations Set Tag List and Get Tag List
- Step 3: Create 2 csv files, one containing the User Defined values for the Set Tag List and another containing the results for the Get Tag List. (GetTagList.csv and SetTagList.csv)
- Step 4: Set up a command script file to include all the commands to run the sensitivity analysis. (UsingSetTagAndGetTagList.ssc)
- Step 5: Run the command script file using SysCAD command Tools | Command Scripts..., select UsingSetTagAndGetTagList.ssc and press execute.
- The advantage with using the SetTagList and GetTagList is that it is much faster when running large number of cases. The disadvantage with using this method is that the csv files do not support formatting.
Project Configuration
- The aim of the project is to demonstrate the Command Script Functionality, so the main configuration for this project are command script files and how to report the findings.
- Command Script files can be created/edited using text editor. Two files are given in the example.
- Each case will test the sensitivity for of the Heat Exchanger, whose purpose is to cool a process stream.
- Case Values can be read and reported either using SysCAD Reports or Using Set/Get Tag List.
- The SetTagList uses 5 different values for heat transfer area and the last case also varies the CW temperature.
- The Excel Report contains the following sets of cases:
- Test Set A uses a number of values for the Heat Transfer Coefficient (HTC) to emulate scaling in the unit.
- Test Set B uses a number of values for the Cooling Water temperature to determine the effect of CW temperature on flow requirements.
- Test Set C (available from Build 139) uses a number of values for the Shell Outlet Temperature (achieved by varying the Shell Feed Bypass Fraction) to determine the effect on CW flow requirements.
- Test Set D (available from Build 139) uses a number of values for the Tube Feed Bypass Fraction to determine the effect on CW flow requirements.
Included Excel Report/CSV Files
- Test Cases.xls - This file is used with Command Script UsingExcelReport.ssc, it contains both Case Configuration data and Case Reporting values.
- SetTagList.csv - This file is used with Command Script UsingSetTagAndGetTagList.ssc, it contains Case Configuration data.
- GetTagList.csv - This file is used with Command Script UsingSetTagAndGetTagList.ssc, it contains Case Reporting values.
Demand Project
Project Location
This is a Steady State project and is stored at:
..\SysCADXXX\Examples\02 Features\Demand Example.spf
Features Demonstrated
- Demand in Pipes and Feeders.
- Using saturated and super-heated steam.
- Example Stream Report
Brief Project Description
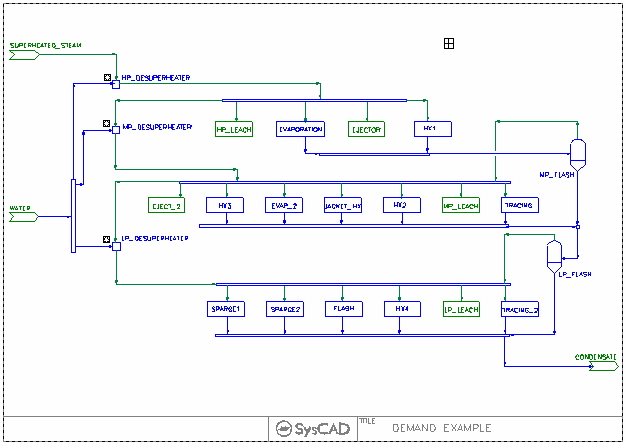
The project shows an overall view of steam usage in a plant.
- The plant is supplied with a single source of super-heated steam.
- The steam is used in the plant at three different pressures, all requiring saturated steam.
- The saturation is carried out in ties with the amount of water added controlled by a PID Controller.
- The steam requirement for each area of the plant is set in the Demand section of the pipe feeding the area.
- A reaction block in each area condenses the steam to water while maintaining the temperature at a constant value. This emulates the conditions in the plant, where the energy from the condensation is taken up with heating requirements.
- Condensate from the higher pressure and temperature steam is flashed to recover steam at the next lower temperature steam required. The steam recovered joins up with the fresh steam feed.
- The General Controller sets the temperature and pressure of the feed steam, as well as the required pressures for the HP, MP and LP steam.
An equivalent project using desuperheater model is available under the Power Plant Set of example projects. This model avoids the use of "PID and Reaction" for the desuperheating step. See Demand Project with Desuperheaters
Project Configuration
- Steam Supply Feeder
- The SuperHeated_Steam Feeder in this project will provide all the steam demanded by downstream processes.
- FeederSink Tab, Select Demand.On, check that Demand.Max will cover the flowrate range for the project. Increase this value if necessary.
- QmReqd will represent the minimum value for the steam supply. If this value is higher than downstream requirements, the excess amount is distributed. Recommend using a small number of this field.
- Define the operating condition and composition.
- SysCAD will calculate the feed flowrate and display it in the Results:Flow Conditions MassFlow field.
- Steam Users
- When defining the steam users / steam distribution, the distribution of steam can be specified in either
- SplitFlows - Operation Demand MassFlow OR
- PIPES - Qm_Demand.Reqd.
- In this example, we have set up the demand network in the pipes. For example, for the HP_Steam_Distributor,
- SplitFlows is NOT selected.
- Outlet Pipes S009 to S012 have steam demand requirements defined in the Pipe-1 Tab, under Qm_Demand.Reqd field.
- HP_Steam_Distributor Tie-1 Tab shows a summary table of the stream demand values.
- It is important that EVERY steam user amount is defined, this will allow the calculation of the total feed required.
Included Excel Report
Steam Report.xlsx - This file includes Steam Diagram and Streams report.
Energy Balance Example
(Only 1 flowsheet is shown above - the project contains a number of separate flowsheets)
Project Location
This is a Steady State project and is stored at:
..\SysCADXXX\Examples\02 Features\Energy Balance Example.spf
Features Demonstrated
Shows the Mass and Energy Balance calculations for the following unit operations:
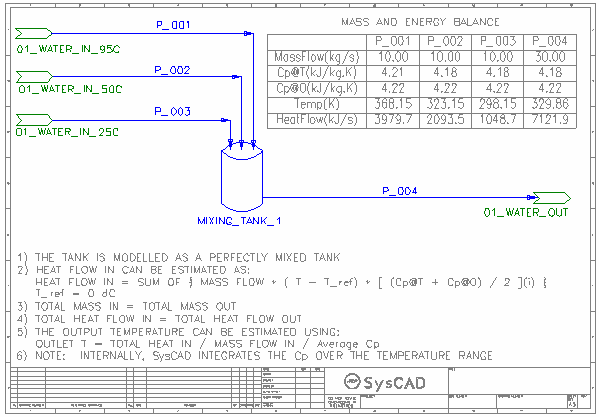
- Simple Mixing tank with multiple inputs.
- Simple Mass separation
- Simple Reactor
- Simple Phase Change (steam to water) using VLE
- Simple Heat Exchanger
- Simple Thickener
Brief Project Description
The project shows the mass and energy balance on the flowsheets as Annotation tables as well as proper reports in the Mass&EnergyBal.xls.
Mass and Energy Balance
- When creating energy balance, it is important to include any reaction / heat gain and heat loss values in the balance.
- When checking the SysCAD results against hand calculation, it is important to note that hand calculation shown is simplified and uses average Cp values (assuming Cp is linear, this is not necessarily true, thus small errors in the hand calculated values).
Included Excel Report
Mass&EnergyBal.xls - This file shows how to create mass and energy balance for process units. Useful for data validation purposes.
Heat of Dilution Project
Project Location
This is a Steady State project and is stored at:
..\SysCADXXX\Examples\02 Features\Heat of Dilution Example.spf
Features Demonstrated
- Heat of Dilution changes the Temperature of the mixed stream.
Brief Description
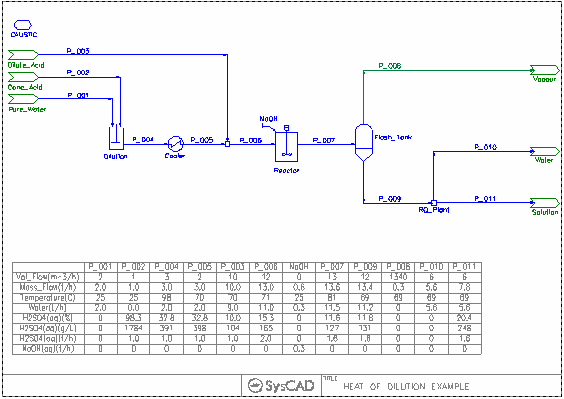
This is a very simple project to show how heat of dilution will affect the temperature of a stream as the component composition changes.
- A stream containing water and one containing concentrated acid 98.3% H2SO4(l) are mixed together to form H2SO4(aq) solution. With the Phase change function switched on, the H2SO4(l) automatically converts to H2SO4(aq) and the heat of dilution is released, resulting in a rise of temperature.
- The stream is cooled to lower the temperature.
- A diluted acid stream is added to further dilute the acid solution. A slight temperature increase is observed.
- The stream is then sent to a reactor where some of the acid is used.
- The reacted stream is sent to a flash tank, where water is evaporated and the mixture is slightly concentrated.
- Water is separated from the product solution via an RO unit, further concentrating the solution and leading to an increase in temperature in the two outlet streams.
For more information on H2SO4, see Sulfuric Acid
See also Example Project HP Autoclave Leach Project
Project Configuration
- Defining and enabling Heat of Dilution
- Add Heat of Dilution data to the Heat of Dilution.
- Switch on View | PlantModel | Species | Auto Phase Change Equilibrium | PhaseChange@MF to enable Heat of Dilution based on concentration.
- The heat of dilution will be applied when the concentration changes.
Lime Preparation (Makeup) Project
Project Location
This is a Steady State project and is stored at:
..\SysCADXXX\Examples\02 Features\Lime Preparation (Makeup) Example.spf
Features Demonstrated
- How to prepare a slurry mixture to be used as the Makeup Source.
- How to set up multiple makeup block in user defined sequence.
- How to calculate Lime requirement in PGM file♦.
- How to use RB block - "ShowSpRequirements" to estimate the lime requirements♦.
- How to use the OptimiseGain PGM class in a project♦.
Brief Project Description
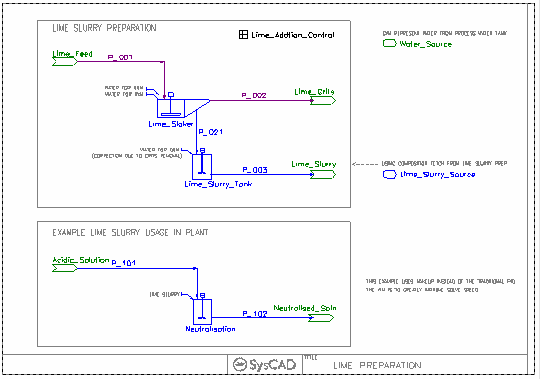
The project shows a lime preparation area.
- The plant demand for the lime slurry is represented by the neutralisation area.
- The Lime slurry is prepared by adding lime and water to the slaker, grits are removed.
- The resulting lime slurry composition is passed onto the Lime_Slurry_Source, so that plant usage of lime slurry can be done via the makeup (MU) blocks.
- The raw lime feed to the plant is calculated from the total lime slurry usage (found in the Lime_Slurry_Source).
Project Configuration
- Lime Preparation
- The lime slaker is setup as follows.
- Based on the lime feed, water is added (stoichiometric ratio) to satisfy the reaction. This is done using MU1.
- Reaction occurs converting Lime to hydrated lime
- Water is then added via MU2 to adjust to solids concentration.
- Grits are removed
- After the grits removal, the solids concentration is slightly out, so water is added to the lime holding tank to adjust the concentration.
- Setting up these makeup blocks will eliminate the need for adding PID controller and provide a faster and more stable solution.
- However if user prefer, they can replace the 3 water MU with a PID controller.
- Lime Slurry Source
- The Lime_Slurry_Source is using composition fetch (output from Lime_Slurry_Tank) to set its contents.
- Lime Slurry Users
- This is represented by the Neutralisation Tank, where Lime Slurry is added based on the stoichiometric ratio to the acid (and other reactants).
- User can also specify Lime in excess or use a PID controller to control to a target pH♦.
- The reaction extents may need to be accounted for when calculating the lime requirements♦.
- Any recycled Lime needs to be subtracted from calculated lime requirements when setting the makeup amount♦.
NOTES:
- Descriptions marked with ♦ refer to new features added to the example project in Nov 2022.
Model Procedure Example
Project Location
..\SysCADXXX\Examples\02 Features\Model Procedure Example.spf
Features Demonstrated
Shows how to write simple user specified model / side calculation using Model Procedure (MP).
Brief Description
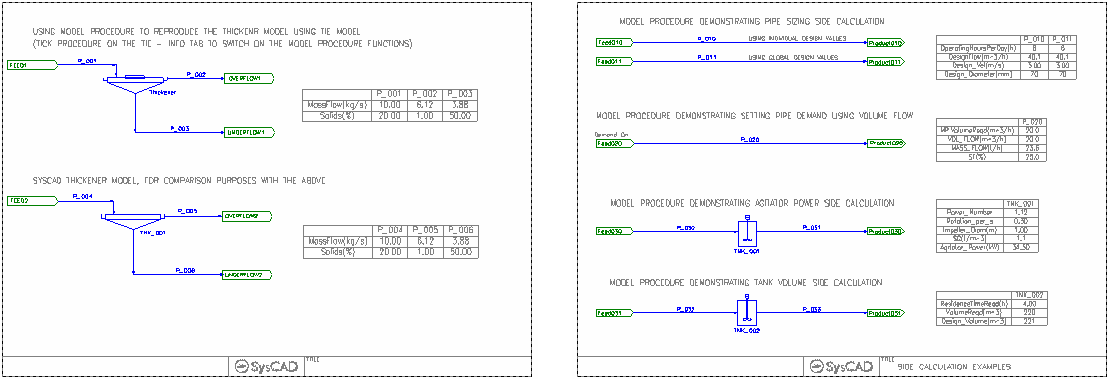
This project has two flowsheets:
- Thickener
- The flowsheet shows how to reproduce the thickener model by using "Model Procedure + Tie Unit Operation", shown at the top half of the flowsheet.
- The bottom half of the flowsheet is the SysCAD Thickener model, shown here for comparison purposes.
- Side Calculation
- pipe sizing Side Calculation, using either local or global parameters.
- Setting demand in the pipe using volume flow.
- Tank Agitator Power Side Calculation.
- Tank Volume based on given residence time Side Calculation.
NOTE that Model Procedure can only be used in Pipes, Ties and Tanks.
To view the MP files online, please see MP Example Files
Project Configuration
- To Enable the Model Procedure
- Right click on Thickener (Modelled as Tie-1 process unit), On the Info Tab, select Procedures
- MP tab will be created, allowing the addition of a MP file.
- MP file is evaluated within the process unit, and can only fetch values local to the current Tie model. Therefore when fetch values, unit Tag name is not used.
- Some global variables can be accessed in the MP file via the Plant Model Class.
- Use the Get() function to retrieve values from SysCAD
- Use the Set() function to set values into SysCAD
- For help on the syntax of the model procedure file, please see Model Procedure (MP).
- For another Example Project containing Model Procedure, please see Glass Sorting Facility, distributed as ..\SysCAD93\Examples\85 WasteRecycling\Glass Sorting Facility.spf
Solubility Example
Project Location
This is a Steady State project and is stored at:
..\SysCADXXX\Examples\02 Features\Solubility Example.spf
Features Demonstrated
- Solubility changes in a project as a function of temperature and changes in dilution.
- Other Solubility Example Projects: Crystallisation Project, Absorption Tower Example Project, Evaporator Flash Train Project, Mechanical Vapour Recompression MVR Example
Brief Description
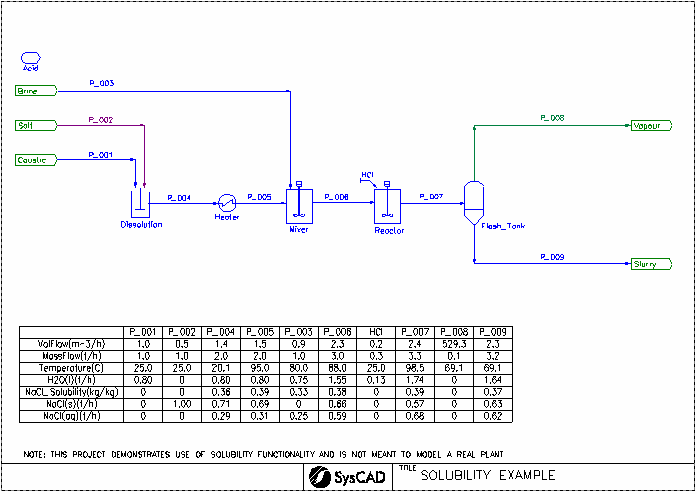
This is a very simple project to show how solubility data will affect a species as temperature changes and solution is diluted or concentrated.
- A stream containing an aqueous potassium hydroxide (KOH) solution and one containing salt (NaCl) are mixed together and the salt dissolves to form a saturated solution.
- The saturated stream is heated and further salt dissolves.
- An unsaturated brine stream is added to the heated stream, and the final stream is saturated at a lower temperature.
- Hydrochloric acid (HCl) solution is added and reacted with the KOH to produce KCl + Water. This dilutes the stream and raises the temperature, leading to dissolution of some of the salt.
- The stream is sent to a flash tank, where water is evaporated and the mixture cooled. Some of the aqueous salt crystallizes out of solution.
Project Configuration
- Defining and Enabling Solubility
- Adding solubility data to the Species database.
- Enable Solubility in individual units using the Solubility.On functionality.
- On the individual PC tab pages:
- Select UserDefined System
- Under User.Config.Fn section, select the Solubility Curve/s of interest, in this example, several solubility curves have been defined in the database, but the project only has NaCl present, so only that one needs to be selected.
- Viewing Solubility Data
- Enable different solubility information on View | PlantModel | Soluble.
- The Solubility data can be found on Pipes, under Qo.Soluble section.
- For units in which the solubility functionality is enabled, the data can be viewed on the PC Tab.
Water Treatment (Demand) Project
Project Location
This is a Steady State project and is stored at:
..\SysCADXXX\Examples\02 Features\Water Treatment (Demand) Example.spf
Features Demonstrated
- How to set up Demand when one of the units in the demand network needs a fixed percent split.
Brief Project Description
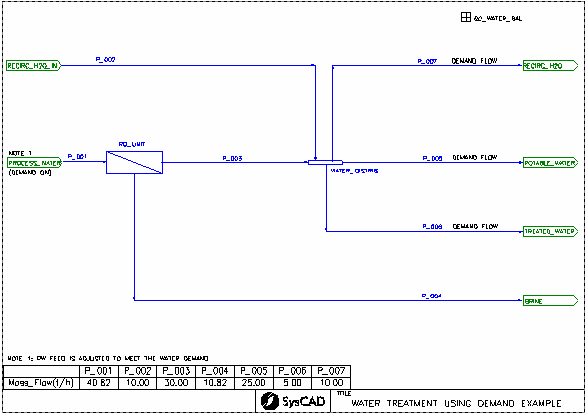
The project shows a very simplified water treatment unit.
- The RO_Unit removes salt (as a brine) leaving treated water for general use in the plant.
- Water usage in the plant is set up as demand network.
- Correct RO_Unit Setting is important to meet the demand network calculation.
Project Configuration
- Demand Network
- ReverseOsmosis passes back a demand flow. The feeder to the RO unit is set up with Demand.On ticked.
- All water outlet streams are set up with Qm_Demand.Reqd flows in the pipes.
NOTE: This is a very simplified water treatment project, with the emphasis on how to set up demand.
For more example relating to water or water treatment, please see
