Size Distribution (PSD)
Navigation: Models ➔ Qualities Models ➔ Size Distribution (PSD)
| Qualities Models | LockUp | Material Tracking | Size Distribution (PSD) | Specific Surface Area (SSA) |
|---|
Latest SysCAD Version: 25 February 2025 - SysCAD 9.3 Build 139.37016
Related Links: Size Distribution Definition, Size Configuration, Size Distribution Models
General Description
This option is used to define and use size distribution data in a project. This information can be used in Size Distribution Models such as the Crusher2 and Screen 2. This option is only be available to users with the Size Distribution add-on.
Configuring Size Distribution
In order for the Size Distribution quality to be available in a project, it must included in the configuration file of the project.
Insert into Configuration file
Sort either by DLL or Group.
| DLL: | SizeDst1.dll |
→ | Species Qualities | → | Size Distribution | |
| or | Group: | Size Distribution |
→ | Species Qualities | → | Size Distribution |
See Model Selection for more information on adding models to the configuration file.
The Size Distribution quality requires further configuration, including defining of a sieve series in the cfg file. Please refer to Size Configuration for more information.
Creating a Size Distribution in a Stream
Open a project which uses a configuration file with Size Distribution configured (as described above).
Creating a Size Distribution in a feeder or pipe:
- On the Feeder|FeederSink OR Pipe|Qi tab page, under Qualities, click on the SzDist.Action list box and select 'Create' (see Qualities Models - Fields and Actions for more information).
- You can only create Size Distribution in a feeder which is not connected to another feeder (either by direct connection or by stream fetch).
- New tab pages called 'DSz', 'Sz' and 'MSz' will become visible.
- The user can define the Size Distribution on the 'DSz' page as described in Size Distribution Definition.
Modify or Remove a Size Distribution
Once a Size Distribution has been created, it will perpetuate through all subsequent units. The Size Distribution can be modified or the Size Distribution quality can be removed altogether in the same way as other Qualities. Please refer to Qualities Models - Fields and Actions for more information.
Note: You may add size distribution back into the plant at any downstream point - this may be the same size distribution, or it can be a different distribution. For example, you may use a coarse size distribution at the front end of the plant for crushing and milling ore and then have a fine size distribution at the back end of the plant for product handling.
Changing Size Distributions
If the Size Distribution needs to be changed on the Feeder level (where the size distribution is created), then the user can simply select the size distribution to be used on the Sz tab page and redefine the size distribution. However, if the size distribution changes down stream - eg, it changes from the coarse distribution to the fine distribution, then the stream of material must pass through the Sieve Changing module unit operation to convert the size distribution.
NOTE: This also applies to mixing of streams with different size distributions. They must be converted to the same distribution before mixing; otherwise, incorrect sizes will result.
Size Data Sections (Sz Tab)
Sz Tab Page
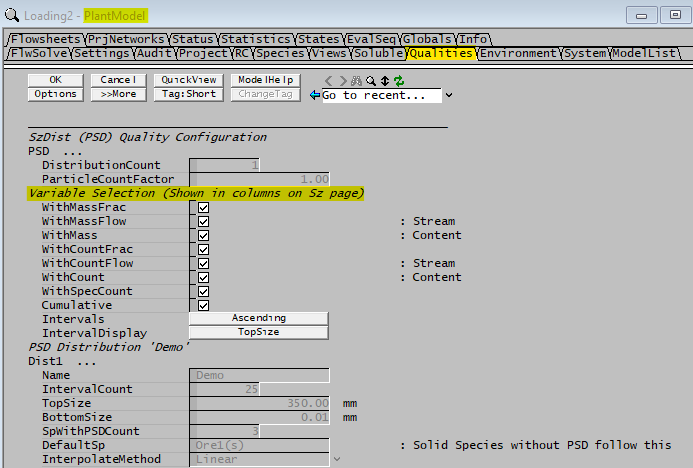
The variable display selection can be altered globally from the menu command View | Plant Model - Qualities Tab page.
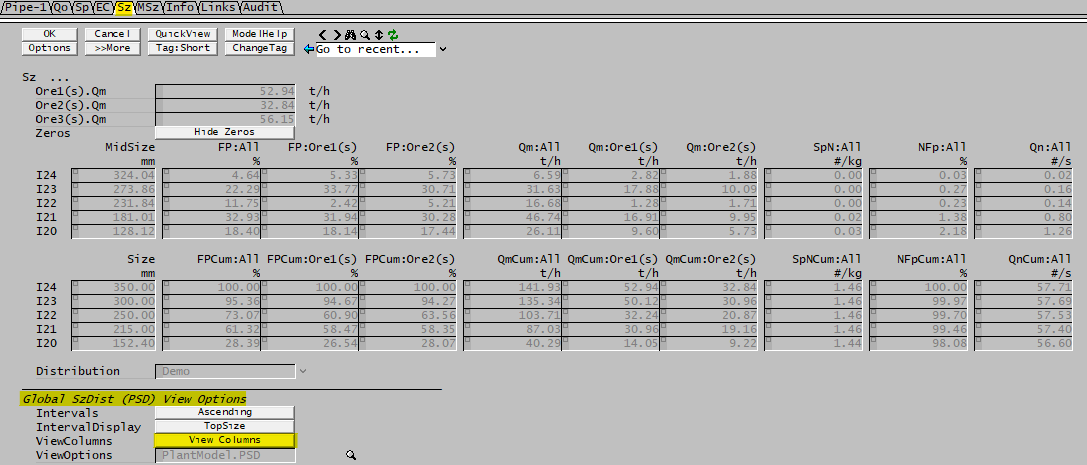
The view below shows the Sz tab of a pipe access window with all fields displayed.
- You may select to show / hide a number of display fields using the View Columns button at the bottom of the pipe access window shown below. To Show or Hide any view, just click on that view from the list.
- The order of the size intervals may be changed by pressing the Intervals button to make it either ascending or descending.
- The Interval display can be shown as Topsize or Midsize for the size interval.
This Tab page displays the parameters described in the next section for each solid with a specified size distribution.
- If you have 2 (or more) solids, Ore1 and Ore2 (as shown in the image above), and each has been specified with a size distribution, then you can choose to see values for each of these ores.
- If there are any solids that were NOT specified to have an associated size distribution in Configuration file, then these solids will be combined with the Default solid (specified in the Configuration file) and SysCAD will assign the same size distribution to them as to the Default solid.
- The mass flow shown for the Default solid will include the flow of the default solid as well as all solids that were NOT specified to have an associated size distribution in Size Configuration file.
Sz Parameter Definitions
| Parameter | Functions / Descriptions | Notes |
|---|---|---|
| MidSize / TopSize: |
SysCAD calculates the MidSize for each size interval using the Geometric Mean (See notes below): |
Depends on the Interval Display selection at the bottom of the tab page. |
| FP: | Fraction passing of the solids - this is the fraction of solids in a size interval. | Select WithMassFrac from Plant Model - Qualities |
| FPCum: | Cumulative Fraction passing of the solids, summing from the smallest size fraction to the largest. | Select WithMassFrac and Cumulative from Plant Model - Qualities |
| Qm: | Mass flowrate of the solid within the size interval | Select WithMassFlow from Plant Model - Qualities |
| QmCum: | Cumulative Mass flowrate of the solids, summing from the smallest size fraction to the largest. | Select WithMassFlow and Cumulative from Plant Model - Qualities |
| M: | Mass of the solid within the size interval | Select WithMass from Plant Model - Qualities (dynamic contents only) |
| MCum: | Cumulative Mass of the solids, summing from the smallest size fraction to the largest. | Select WithMass and Cumulative from Plant Model - Qualities (dynamic contents only) |
| SpNCum: | Cumulative Number of Particles per unit mass of solids, summing from the smallest size fraction to the largest. | Select WithSpecCount and Cumulative from Plant Model - Qualities |
| NFp: | Number of Particles for the size interval as a percentage of the total number of particles. Calculation shown below:
|
Select WithCountFrac from Plant Model - Qualities |
| NFpCum: | Cumulative Number of Particles for the size interval as a percentage of the total number of particles, summing from the smallest size fraction to the largest. | Select WithCountFrac and Cumulative from Plant Model - Qualities |
| Qn: | Number of Particles per unit time. To calculate Qn for a Size Interval where the interval is i and the mass rate is [math]\displaystyle{ Qm_i }[/math] :
|
See notes below for Mean Particle Mass equation. Select WithCountFlow from Plant Model - Qualities |
| QnCum: | Cumulative Number of Particles per unit time, summing from the smallest size fraction to the largest. | Select WithCountFlow and Cumulative from Plant Model - Qualities |
| N: | Number of Particles within the size interval. To calculate Qn for a Size Interval where the interval is i :
|
See notes below for Mean Particle Mass equation. Select WithCount from Plant Model - Qualities |
| NCum: | Cumulative Number of Particles within the size interval, summing from the smallest size fraction to the largest. | Select WithCount and Cumulative from Plant Model - Qualities |
| SpN: |
Number of Particles per unit mass of solids. To calculate the SpN for a Size Interval where the interval is i :
|
See notes below for Mean Particle Mass equation. Select WithSpecCount from Plant Model - Qualities |
NOTES:
- Geometric Mean - The geometric mean is not always displayed, but is used in most Size Distribution Models
- SysCAD also calculates the Geometric mean for each size fraction as shown below:
- [math]\displaystyle{ \bar d_i = \sqrt{d_i \times d_{i-1}} }[/math]
- except in the case of i = 0, where the following equation is used:
- [math]\displaystyle{ \bar d_0 = \sqrt{d_0 \times d_{b}} }[/math]
- where db is the Bottom Size defined by the user in the Size Distribution section of the Size Configuration.
- SysCAD also calculates the Geometric mean for each size fraction as shown below:
- Mean Particle Mass: [math]\displaystyle{ \bar m_i }[/math] based on Geometric Mean given above.
- [math]\displaystyle{ \bar m_i=\cfrac{\pi}{6} \times \bar d_i^3 \, \times \rho_{S} \qquad }[/math] where [math]\displaystyle{ \rho_S }[/math] is the solids density of the PSD species.
- CountFactor- The CountFactor [math]\displaystyle{ C_f }[/math] mentioned in the SpN and Qn equations is specified in the Measurements Tab of the Model configuration.
- This is a correction which is applied when calculating particle numbers from masses. It allows client specific models which have different characteristic average particle sizes in a bin to correctly display particles numbers. Further if PSD calculations implemented in client specific model are based on numbers (as is the case for agglomeration for example), the count correction is applied when these numbers are calculated, and when the numbers are reconverted to mass fractions.
- SysCAD uses the Geometric Mean as described above for "average" diameter of a size interval. However there are other ways of characterizing the 'typical' diameter of a particle in a size interval (bin). For example, if the diameters are uniformly distributed between the minimum and maximum diameter of a particular bin, the volumes will not be uniformly distributed.
- To illustrate, suppose we have a bin containing particles with diameters between 1 and 2 microns. The volumes of these particles will range between [math]\displaystyle{ \pi/6 }[/math] and [math]\displaystyle{ 8\pi/6 }[/math] cubic microns.
- Using an arithmetic mean the average volume would be [math]\displaystyle{ 3.375\pi/6 }[/math], whereas for this particular distribution, the average volume is [math]\displaystyle{ 3.75\pi/6 }[/math], corresponding to a particle of diameter [math]\displaystyle{ {3.75^{1/3}=1.55361} }[/math] microns.
- The difference factor is [math]\displaystyle{ 1.55361/1.5 = 1.035744 }[/math]
Size Measurements Data Sections (MSz Tab)
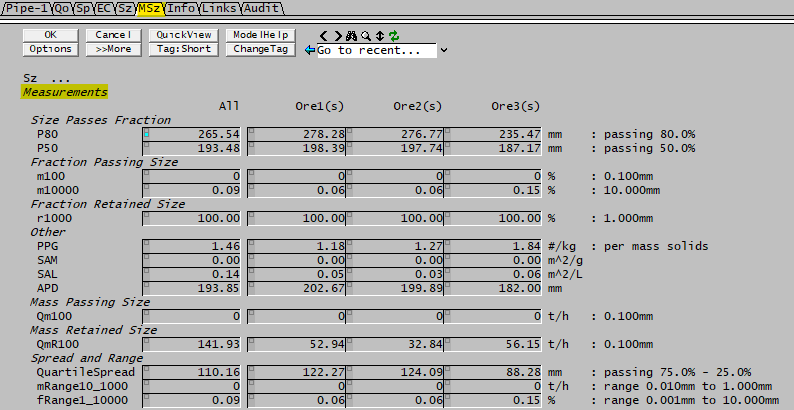
By default, the MSz Tab Page the variables displayed on this tab page are either by default or user defined on the configuration file Measurements tab. See Measurements for further information and configuration of measurements.
For example, some display fields that may be present are shown below:
MSz Parameter Definitions
| Size Passes Fraction | P80: | Size passing fraction = 80%. Fraction set in the configuration file. |
| P50: | Size passing fraction = 50%. Fraction set in the configuration file. | |
| Fraction Passing Size | m100: | Fraction passing 100 microns. The size interval definition is set in the configuration file. |
| m10000: | Fraction passing 10000 microns (10 mm). The size interval definition is set in the configuration file. | |
| Fraction Retained Size | r1000: | Cumulative retained fraction at specified size of 1000 microns (1mm). The size interval definition is set in the configuration file. |
| Other | PPG: | Total Particle Count per Mass. This is calculated as shown below:
|
| SAM: | Surface Area Mass basis (per Gram). This is calculated as shown below:
| |
| SAL: | Surface Area per Liter
NOTE:
| |
| APD | Average particle diameter based on Fraction Passing and Geometric mean size of each size interval | |
| Mass Passing Size | Qm100 | Cumulative passing mass at specified size. The size interval definition is set in the configuration file. |
| Mass Retained Size | QmR100 | Cumulative retained mass at specified size. The size interval definition is set in the configuration file. |
| Spread and Range | QuartileSpread | Difference in sizes at two specified cumulative passing fractions:75.0% - 25.0%. Range definition is set in the configuration file. |
| mRange10_1000 | Mass flow between two different size ranges: 0.010mm to 1.000mm. Range definition is set in the configuration file. | |
| fRange1_10000 | Mass Fraction between two different size ranges: 0.001mm to 10.000mm. Range definition is set in the configuration file. |
Hints and comments
- If a component defined to carry size information enters a stream, it will be defaulted to carry 100% of the top size material unless a distribution is defined. Caution should be taken to fully define all input streams carrying components that are defined to have size information.
- The Show and Hide List box on the Sz page allows the user to customise the Displayed information on the access window. FP (Fraction Passing), FPCum (Cumulative Fraction Passing), Qm (Mass) and QmCum (Cumulative Mass) are the four options available per compound.
- The size distribution can be viewed in ascending or descending order by using the Size intervals toggle button.
- Make sure a Change Sieve Series unit is used whenever a change of distribution is required.


