Animation Commands
Navigation: User Guide ➔ Menu Commands ➔ Graphics ➔ Animation
| Insert | Edit | Delete | Copy & Paste | Display | Animation | Symbol Management | Construct |
|---|
Latest SysCAD Version: 25 February 2025 - SysCAD 9.3 Build 139.37016
Introduction
This is a subset of the graphics commands which are used to draw and manage SysCAD flowsheets.
Note: SysCAD must be in the Edit mode (stopped) for most of these commands to be accessed.
Annotation Table
Insert Annotation Table
| Command Button | |
| Command Path | Graphics - Animation - Insert Annotation Table |
| Short Cut Key | "Ctrl + Shift + N" |
This command will allow a user to insert a table into a SysCAD flowsheet. The table displays of models, such as pipes, tanks, heat exchangers, etc., and measured variables in each model, such as Flow, Temperature, Duty, etc.
Before creating the Annotation Table, first open the access window of the model type you are interested in (e.g. Pipe for stream table), that way you can see the valid variable tag names needed to create the annotation table.
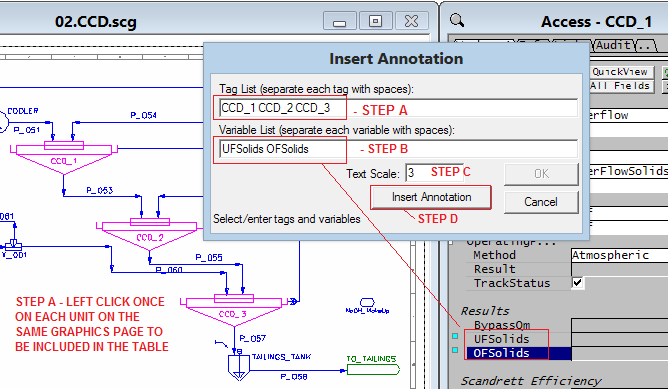
To create the annotation table, select the Insert Annotation Table command to open the 'Insert Annotation' dialog box:
|
In Build139 and later, variable tags can be added using the right click popup - Send to Annotation. (During Step B). 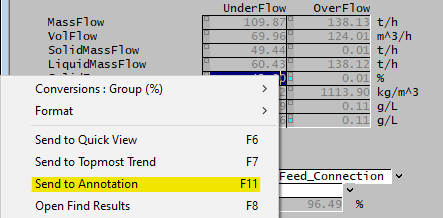
|
| Step | Description | Notes |
| A | Select the unit operation TAG(s) |
|
| B | Define the variable list. |
|
| C | Annotation Scale |
|
| D | Insert Annotation |
|
| E | Editing Annotation Table |
|
Some Example Variable Lists for selected Unit Types
| Unit Type | Example List of Variables |
|---|---|
| Streams - Standard |
|
| Makeup Sources - Standard |
|
| Streams - Alumina |
|
| Streams - Potash |
|
| Streams - Sugar |
|
| Heat Exchangers |
|
| Shell and Tube Heat Exchangers |
|
| Solid Liq Separators |
|
| Precipitator3 - Alumina |
|
Update Annotation Table
| Command Button | |
| Command Path | Graphics - Animation - Update Annotation Table |
| Short Cut Key | "Ctrl + Alt + N" |
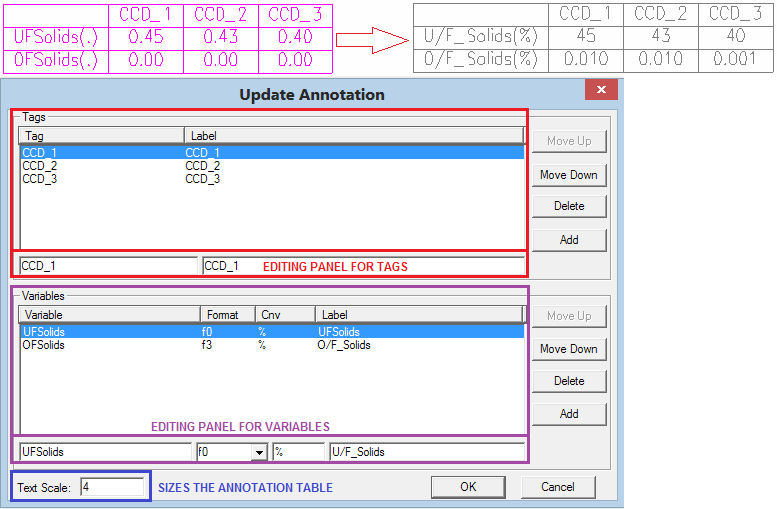
Once an annotation table is in place, user can use Update Annotation table to change the engineering units, number format and label of the unit and variable tags.
- To add a new Tag or Variable, press the Add button, this will create a duplicate of the Tag/Variable on the list. Edit the information of this duplicate tag to become the new tag/variable, this may include Tag/Variable name, display Label, variable format and conversions.
- You can assign a label to a tag as well as to a variable. These labels will be used in the annotation table.
- You can also customise the displayed numbers' format and conversion units in the update annotation dialog box.
- You can change the size (scale) of the annotation table using the Text Scale input box.
- Press OK when finished to update the annotation table.
NOTES:
- Duplicate tag / variable will be discarded
- Invalid tag / variable will be discarded
Refresh Annotation
| Command Path | Graphics - Animation - Refresh Annotation |
This command updates the annotation table on the active Graphics Window.
Refresh All Annotation
| Command Button | |
| Command Path | Graphics - Animation - Refresh All Annotation |
This command updates all annotation tables on all Graphics Windows.
Fill Area
Insert Fill Area
| Command Button | |
| Command Path | Graphics - Animation - Insert Fill Area |
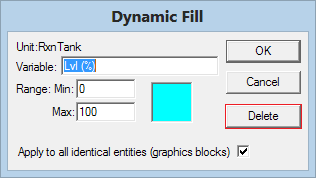
This command allows you to add dynamic fill animation to a graphics symbol. It is commonly used to observe parameters such as vessel level or temperature. To do this, the dynamic fill animation block needs to be added to a graphics symbol. On the dynamic fill dialog box:
| Step | Description | Notes |
| A | Select Variable | The most common variable used is Level, Lvl (%), for a tank. However, the user could type in T (C), for Temperature, or any other measured variable. |
| B | Range | Define the Minimum and Maximum values. For example, for a tank level Min = 0 and Max = 100%. For Temperature the minimum and maximum would be defined by the user based on the expected temperature range. |
| C | Colour Box | This box allows the user to select a preferred colour. To change the colour click on the box and select a colour from the pallet. |
| D | Apply to all identical entities | 1. If this tick box is enabled then all of the existing symbols for the same model on the same Graphics Window will have a dynamic fill added. 2. This only applies to existing units on the same Graphics Window. If you add a unit with the same symbol AFTER you have added the fill annotation, it will not have the fill included. |
| E | Select UNIT | Once information is provided in the dynamic fill dialog box, the user may select the unit by clicking on the required unit in the graphics window. The mouse cursor will display UNIT when moved over the Graphics Window. |
| F | Select POINTS | Once the UNIT has been selected the mouse cursor then changes to POINT. Click the mouse button to draw points to form a block. Note that lines do not snap to horizontal or vertical lines, and diagonal lines are allowed so that a cone can be drawn if required. Press OK on the dialog box to accept the dynamic fill or press Cancel to start again. NOTES: 1. We recommend that you zoom into the unit to which the FILL is being added so that you can accurately follow the unit lines. Also, temporarily reducing the mouse cursor speed (in Control Panel) makes it easier to finely position the selected points. |
| G | Running | The dynamic fill will be animated when run is started. Check configurations option in Tools - General Options - Graphics. |
WARNING: Before using the Fill command, make sure the correct Graphics Window is the active window.
Update Fill Area
| Command Button | |
| Command Path | Graphics - Animation - Update Fill Area |
Once a fill area is in place, it can be updated using the Update Fill Area command.
- Move the mouse over to the Graphics Window and the mouse cursor will display UNIT, click on the fill area you wish to update, and the fill area dialogue box will open, this time it has an extra button delete.
- You can change the variable and minimum/maximum values as per inserting a fill area.
- If you are using 'Lvl' (without the engineering units), the Max value should be 1, not 100.
- A fill area can be removed by pressing delete.
- If the Apply to all identical entities option is on, all fill areas for that unit type will be deleted.
- The graphics for the fill area block will not be deleted. See below for how to remove the unwanted dynamic fill graphics.
- If you have pressed update fill area and could not find a fill area, you can exit out of the option by either right clicking on the Graphics Window or choosing another option like redraw.
Hints on removing unwanted Dynamic Fill graphics:
If the dynamic fill is drawn incorrectly and user wish to reapply the dynamic fill to the exact same symbol, follow these steps to clear and reapply the dynamic fill:
- Use Change Symbol to choose a new temporary symbol (this can be whatever as we will change it back to the current symbol in step 5). If there are multiple "incorrect symbols" on the current flowsheet, change them all.
- Save the project as is.
- Close the Exit SysCAD. (These three steps should force SysCAD to delete any unused symbol in the graphics file)
- Start SysCAD and Open the project.
- Use Change Symbol to change the symbol back to the Correct Symbol.
- Use Insert Fill Area as usual.
Dynamic Bars
Insert Dynamic Bars
| Command Button | |
| Command Path | Graphics - Animation - Insert Dynamic Bars |
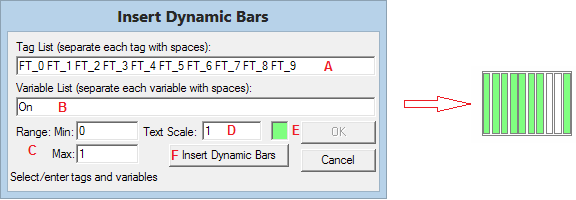
This command will insert bar(s) with animation to indicate changing variables. The variables could be Levels, Temperatures, concentration, on/off status or user defined pgm variables.
| Step | Description | Notes |
| A | Select the unit operation TAG(s) |
|
| B | Define the variable list. |
|
| C | Range | Define the Minimum and Maximum values, the range specified here will be applied to ALL the variables. User can use Update Dynamic Bars later to change individual ranges if required. In this example, on/off range would be 0 and 1. |
| D | Text Scale | The scale can be changed now or later using Update Dynamic Bars. |
| E | Colour Box | This box allows the user to select a preferred colour. To change the colour click on the box and select a colour from the pallet. The colour selection here will apply to all variables, user can use Update Dynamic Bars later to change individual colours if required. |
| F | Insert Dynamic Bars | 1. The Dynamic Bars graphic becomes visible on the graphics window and the mouse pointer changes to a X with 'POS' and the 'Insert Dynamic Bars' button changes to 'Position Selected'. The user can now left click with the mouse button on the Graphics Window to position the Dynamic Bars to a more appropriate position. 2. The placement point of the Dynamic Bars is bottom left-hand corner of the Dynamic Bars. 3. The user may continue clicking on the graphics until they are happy with the position of the Dynamic Bars. 4. When the user is happy with the Dynamic Bars position, press OK to close the 'Insert Dynamic Bars' dialog box. |
| G | Adding More Dynamic Bars | When the position of the previous Dynamic Bars is finalised, you can press OK to finish or Position selected to start creating another Dynamic Bar entity. |
| H | Editing Dynamic Bars | 1. After a Dynamic Bar is created, it can be moved with the Move Entity Command. 2. The Dynamic Bars cannot be resized using the Scale/Rotate command. To change or update the Dynamic Bars, the Update Dynamic Bars command must be used. |
WARNING: If a dynamic bar is applied to a unit, changing the unit name will result in the loss of the dynamic bar information.
Update Dynamic Bars
| Command Button | |
| Command Path | Graphics - Animation - Update Dynamic Bars |
Once a dynamic bar is in place, it can be updated using the Update Dynamic Bars option.
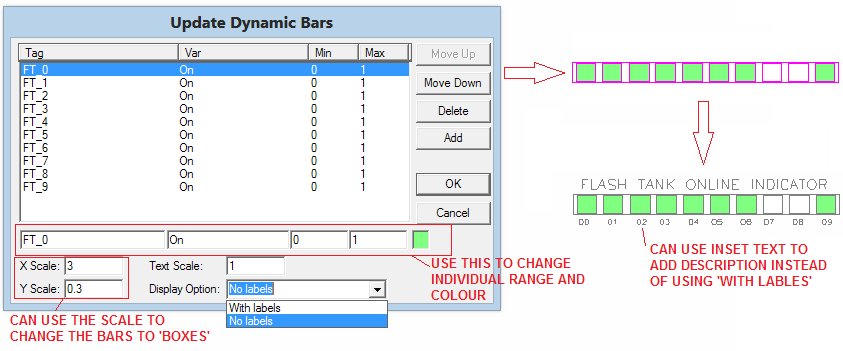
- Move the mouse cursor over to the graphics page and click on the dynamic bars entity you wish to update. This opens the Update Dynamic Bars dialog box.
- To update an entry, highlight it in the list and change the variable in the editing boxes towards the bottom, just above the scale box. Tags can be added or deleted.
- To add a new entry, click on an existing tag, press add, edit it to represent the new tag, and then click on the tag list section to accept the tag in the list.
- The order of the tags can be adjusted using the move up and move down button.
- Each tag on the dynamic bar list can have a different colour, to change the colour, just click on the tag, then change the colour box on the bottom right hand corner. Once ready, press OK to update the colour.
- User can use the X and Y Scales to size the width and height of the Dynamic bars.
- Sizing is also done relative to a Text Scale, based on the text required (width of sum of characters) and the text scale it then sizes the graphics. Because of this, Dynamic bars with different length of text string would appear in different sizes even though the text scale is the same for all of them.
- The Display Option can be used to not display the labels, which results in a more compact graphical symbol.
- The Dynamic bar is a graphics entity and it can be repositioned using the Graphics - entities - Move function.
Example of Dynamic Bar with Text Label showing:
Toggle
Insert Toggle
| Command Button | |
| Command Path | Graphics - Animation - Insert Toggle |
The procedure in creating a toggle is similar to that of Insert Dynamic Bars.
NOTES:
- A Toggle is used to animate variables (inputs or results) that are True or False ("on" / "off").
- For a toggle associated with an input variable, it is not possible to use the graphics toggle symbol to change the state of the underlying tag variable. It is a result display only.
- The Toggle is always RED, you cannot change the colour. Shows red for True, and no colour for false.
- If a toggle is applied to a unit, changing the unit tag name will result in the loss of the toggle animation information. Use Update Toggle to manually fix the tag, or delete and recreate the Toggle display.
- The colour animation of the toggle is not automatically updated as the variable changes (display is not "live"). The display is updated with redraw, solver stop, etc.
Update Toggle
| Command Button | |
| Command Path | Graphics - Animation - Update Toggle |
Once a toggle entity is in place, it can be updated. The procedure in updating the toggle entity is as per Update Dynamic Bars.
