Signal Waveform
Navigation: Models ➔ Control 2 Models ➔ Signal Waveform Controller
| Get Tag List | Set Tag List | Noise Controller | Slew Rate Controller | Downtime | Events | Scheduled Events | Profile | Queue Profile | Signal Waveform |
|---|
General Description
The Signal Waveform Controller model is used in Dynamic projects. It allows input of periodic data, either by regular geometric patterns or from user-input data. This is used to simulate process variation based on a repeating periodic signal. It can be used to add regular disturbance to process variables, e.g. to Feeders or Dynamic Transfer flow capacity, or to simulate the effect of cyclical data (e.g. water addition via annual rainfall patterns).
- A three-part discussion series "Annual Climate Data for Dynamic Modelling" provides additional background on the development and use of this controller with user-input data for pond modelling with annual rainfall and evaporation.
Diagram
The diagram shows the default drawing of the Signal Waveform control unit.
Inputs and Outputs
There are no connections to this unit.
Model Theory
Waveform generation has two broad categories, each with various forms:
- Regular geometric patterns
- Flatline (None)
- Sine Wave
- Square Wave
- Triangle Wave
- Sawtooth Wave
- User-input data
- Linear DataPoints
- Linear Averages
- Spline DataPoints
- Spline Averages
- B-Spline DataPoints
These cyclical patterns repeat with a user-defined period. TimeOffset can be used to start the cyclical pattern at an offset time within the cycle. Note that use of TimeOffset requires the Events/Profiles Startup Reset Action to be selected.
Regular Geometric Patterns
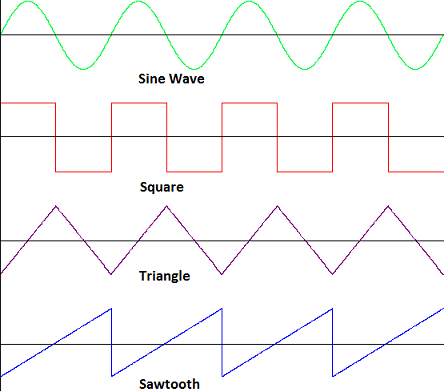
The following regular geometric patterns are available. In addition, a flatline (None) option can be used to output a constant value.
An option is included to choose between ascending (as in the image above) and descending sawtooth.
Sine Wave Function
- [math]\displaystyle{ y(t) = (Max - Centre) + \cfrac{PeakToPeak}{2} * sin \left( \cfrac{2\pi * (t + TimeOffSet)}{Period} \right) }[/math]
- where
- Max = Maximum value
- Centre = Mid point of the Peak to Peak value = (Maximum value - Minimum Value)/2.
- PeakToPeak = Peak to Peak value on the y scale, Maximum value - Minimum Value.
- Timeoffset = Starting point (time) of wave, if Timeoffset = 0, then the sine wave will start at centre value.
- t = time, each iteration t = t + step size.
- Period = 1/Frequency, time taken for one full wave cycle.
For example
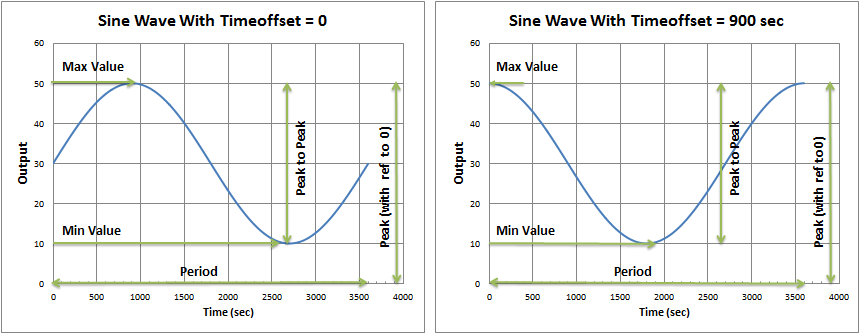
- If the min feed is 10 t/h and the Max feed is 50 t/h, using a Period of 1 hour with no time offset, the sine waveform will generate the feed input curve as per left image below.
- If the time offset is 900 seconds (15 mins, or 1/4 of the total period), then the sine wave is shifted by 1/4 cycle, as per the right image below:
User-Input Data
Introduced in Build 139.30874, user-input data may be used to define a repeating pattern as a waveform.
For each of these user-input data options, the DataPointsCount or number of equally-spaced data points (intervals) within a period is defined, as well as the data value at each of these points.
Various configurations are possible, with choice between:
- Data input as instantaneous Data Points or as interval Average Data
- Linear or Spline fitting between data points
- Data points at interval Start-Point or Mid-Point (applicable for Data Points options only)
The following sections detail the key differences between input of Data Points and Average Data.
Data Point Input
The DataPoints options use data input to represent an instantaneous point in time, with options for data interpolation between the defined points. In each case, the interpolated data passes through each of the defined data points (i.e. there is no data smoothing or averaging).
The following options relate to how data is interpolated between the data points:
- Linear (Linear DataPoints) - A straight line is drawn between each consecutive data point.
- Spline (Spline DataPoints) - A regular cubic spline is fit through all data points, with the boundary condition that curvature and slope are continuous across the period edge such that it wraps around smoothly.
- This array-based calculation uses the full data set and gives a smooth curve through all data points.
- The mathematics behind this periodic spline is explained in depth here.
- B-Spline (B-Spline DataPoints) - A cubic B-spline (basis spline) is fit through the data points, also with smooth wrap around.
- This option uses local data points to calculate cubic functions between points. The resulting curve is similar to a regular spline, but curvature may change more sharply at some points.
For each of the interpolation methods above, a checkbox option (UseAsMidPoints) allows data to be offset by half an interval, such that the input data points are positioned at the mid-point of each interval rather than at the start.
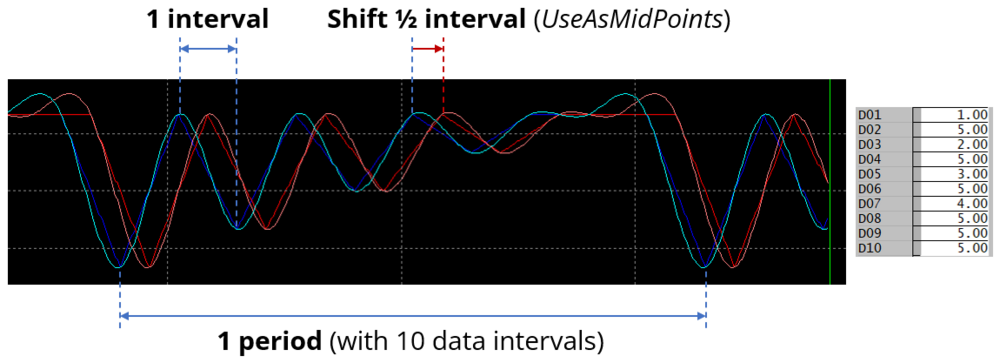
In the diagram below, the four curves are produced from the same set of input data points.
- The blue set shows Linear (straight lines) and Spline (continuous curve) with no MidPoint offset. Here the data points are at the beginning of each interval.
- The red set shows the same (Linear and Spline) with with MidPoint offset. The data points are now at the midpoint of each interval, i.e. offset by half an interval.
B-Spline is not shown, but results in a similar curve to Spline, though slightly less "rounded".
Note that the spline curves may exceed the maximum or minimum values shown in the access window. These MinValue and MaxValue terms refer only to the data points themselves, which are used directly as the spline "knots".
Average Data Input
Annual Climate Data for Dynamic Modelling |
The Averages options use data input to represent an average value for each interval. In this case, mid-point is meaningless as the input data applies to the whole interval. In this case there are two options:
- Linear (Linear Averages) - A flat line is drawn through each interval at the defined value.
- Spline (Spline Averages) - A cubic spline is fit such that the area under the curve in each interval is the same as for Linear Averages.
- IMPORTANT: In this case the spline does not pass through the defined data points, but instead through calculated spline "knots" to conserve area under the curve.
- This option is extremely useful in Dynamic simulation where the total over time must be conserved while maintaining a smooth data input to minimise model disturbance.
- The mathematics behind this periodic averaging spline is discussed in depth here.
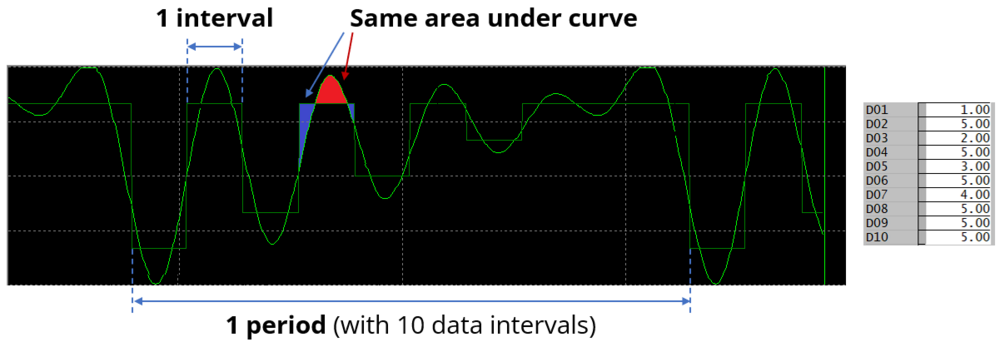
In the diagram below, the two curves are produced from the same set of input data.
- The dark green line shows the linear averages in each time interval.
- The light green curve shows the spline fit through the data set such that the area under the curve in each interval is conserved.
As with Data Point Input, note that the spline curve may exceed the maximum or minimum values shown in the access window. In the averaging spline case, these MinValue and MaxValue terms refer to the min and max of the internally-calculated spline "knots", which are not equivalent to the input data.
Data Sections
The default sections and variable names are described in detail in the following tables. The default Waveform Controller access window consists of 3 sections. This number may increase or decrease, based on user configuration.
Summary of Data Sections
- SignalCon tab - Contains a summary of all of the individual Waveform Controls contained in the unit.
- SW Tabs tab - This page contains all of the information for each individual Waveform Controls, starting at 1 for the first Waveform Controls.
- Info tab - Contains general settings for the unit and allows the user to include documentation about the unit and create Hyperlinks to external documents.
SignalCon
Unit Type: SignalCon - The first tab page in the access window will have this name.
| Tag (Long/Short) | Input / Calc | Description/Calculated Variables / Options |
| Tag | Display | This name tag may be modified with the change tag option. |
| Condition | Display | OK if no errors/warnings, otherwise lists errors/warnings. |
| ConditionCount | Display | The current number of errors/warnings. If condition is OK, returns 0. |
| GeneralDescription / GenDesc | Display | This is an automatically generated description for the unit. If the user has entered text in the 'EqpDesc' field on the Info tab (see below), this will be displayed here. If this field is blank, then SysCAD will display the UnitType or SubClass. |
| Requirements | ||
| On | Tick Box | The Overall Waveform Control unit will be enabled or disabled using this box. This means that all of the independent Waveform controllers in the unit will be disabled. |
| Count | Input | The number of independent Waveform controllers required. This may be any number from 1 upwards. The user may also change this number at any time. The unit will always add new Waveform controllers after existing ones. User may delete individual Waveform using the 'Delete Me' button under the individual Waveform controller blocks. |
| SetAtStartUp | Tick Box | With this option selected, the waveform controller output tags will be set during Startup step. |
| CommonPeriod | Tickbox | If this option is selected, then all the individual waveform controller blocks in the current unit will use the same Time period and offset. |
| TimePeriod | Input | Only visible if the CommonPeriod option is selected, all the individual waveform controller blocks in the current unit will use the same Time period. |
| Frequency | Calc | The frequency of the cycle. The reciprocal of TimePeriod. Frequency = 1 / TimePeriod. |
| TimeOffset | Input | Only visible if the CommonPeriod option is selected, all the individual waveform controller blocks in the current unit will use the same offset. |
| Options | ||
| ShowCnv | Tick Box | With this option selected, SysCAD will display engineering units for the Output tag. Note that these will only be displayed after SysCAD has completed at least one iteration. |
| ShowOnePerPage | Tick Box | With this option selected, SysCAD will display each controller block per tab page. If not selected, each page displays four waveform Controllers. |
| Check Tags | Button | SysCAD will perform a check on the validity of the tags and functions used in the waveform controllers. |
| Summary Shows a summary table with the following values for each individual waveform controller in the unit. | ||
| SW | Display | The waveform Controller number |
| Action | On | The waveform generator is on and the controller will be setting the output tag. |
| Off | The waveform generator is off and the controller will NOT be setting the output tag. | |
| Manual (User) | The waveform generator is off but the controller will be setting the output tag to the User value (ManualOutput). | |
| Manual (Min) | The waveform generator is off but the controller will be setting the output tag to MinValue. | |
| Manual (Max) | The waveform generator is off but the controller will be setting the output tag to MaxValue. | |
| Manual (Centre) | The waveform generator is off but the controller will be setting the output tag to the Centre value (MaxValue-MinValue)/2. | |
| Output | Display | The output value for the individual waveform controller. |
| OutputUnitTag | Display | The Unit Operation Tag for each individual waveform Controller. For example: If the Output Tag is Plant_Feed.QmReqd (t/h), then the OutputUnitTag is Plant_Feed. |
SW1: Individual Signal Waveform Controller Data Fields
Individual Waveform Controllers are displayed on the SWx pages.
- If "ShowOnePerPage" is NOT selected, then each page displays up to four Waveform Controllers.
- If "ShowOnePerPage" is selected, then each page displays one Waveform Controller.
| Tag (Long/Short) | Input / Calc | Description/Calculated Variables / Options |
| [SW number] | ||
| Action | On | The waveform generator is on and the controller will be setting the output tag. |
| Off | The waveform generator is off and the controller will NOT be setting the output tag. | |
| Manual (User) | The waveform generator is off but the controller will be setting the output tag to the User value (ManualOutput). | |
| Manual (Min) | The waveform generator is off but the controller will be setting the output tag to MinValue. | |
| Manual (Max) | The waveform generator is off but the controller will be setting the output tag to MaxValue. | |
| Manual (Centre) | The waveform generator is off but the controller will be setting the output tag to the Centre value (MaxValue-MinValue)/2. | |
| Name | Input | The user may give the waveform Controller a name that describes the control, such as Feed_Variation. |
| Index | Display | Controller Index. Useful for sorting the controller in reports. |
| WaveformType | None | Waveform that outputs a flat line at the Centre value (MaxValue-MinValue)/2. |
| Sine | Waveform that completes one sine wave in the period, starting from the midpoint value. See Model Theory - Regular Geometric Patterns. | |
| Square | Waveform that uses the Minimum value for 1/2 cycle then the Maximum Value for 1/2 cycle to complete one full wave cycle. See Model Theory - Regular Geometric Patterns. | |
| Triangle | Waveform that starts from the Minimum value, then linearly increases to the Maximum value, thereafter linearly reduces to the Minimum valve to complete one full wave cycle. See Model Theory - Regular Geometric Patterns. | |
| Sawtooth | Waveform that starts from the Minimum value, then linearly increases to the Maximum value to complete one full wave cycle. (Or from Maximum to Minimum if DescendingSawTooth is ticked.) See Model Theory - Regular Geometric Patterns. | |
| Linear DataPoints | Waveform with straight lines between each input data point. See Model Theory - Data Point Input. | |
| Linear Averages | Waveform with flat lines within each interval at the input data value. See Model Theory - Average Data Input. | |
| Spline DataPoints | Waveform with cubic spline fit through each input data point. See Model Theory - Data Point Input. | |
| Spline Averages | Waveform with cubic spline conserving area under the curve within each interval (compared to Linear Averages). See Model Theory - Average Data Input. | |
| B-Spline DataPoints | Waveform with cubic B-spline fit through each input data point. See Model Theory - Data Point Input. | |
| ManualOutput | Input | Only visible when Action is set to Manual (User). The output tag will be set to this value instead of a waveform generated number. |
| DescendingSawTooth | Tick Box | Only visible when WaveformType is set to SawTooth. Changes direction of the SawTooth function from ascending to descending. |
| PreventNegative | Tick Box | Only visible when WaveformType is one of User-Input Data. Any output data which would be negative is output as zero. |
| UseAsMidPoints | Tick Box | Only visible when WaveformType is one of Data Point Input. Shifts the data 1/2 interval forward such that the instantaneous data points are at the interval mid-point. |
| MinValue | Input | The minimum value of the output tag to be generated by the waveform generator. |
| MaxValue | Input | The maximum value of the output tag to be generated by the waveform generator. |
| PeakToPeak | Calc | The output tag range, which is equal to (Max Value - Min Value). |
| Centre | Calc | The mid point value of output range, which is equal to (Max Value - Min Value) / 2. |
| Period | Input/Calc | The time period of 1 full wave. See Model Theory. If CommonPeriod option is selected on the SignalCon Tab, then this field is read only. |
| Frequency | Calc | The reciprocal of Period. Frequency = 1 / Period. The frequency of the cycle. |
| TimeOffset | Input/Calc | The starting time for the waveform. If TimeOffset = 0, then the waveform will start at time=0. If CommonPeriod option is selected on the SignalCon Tab, then this field is read only. |
| OutputTag | Input | This is Tag that will be manipulated - this tag must be copied from the relevant unit. For example: Plant_Feed.QmReqd (t/h), Feed_Water.T_Reqd (C) or P_001.Qm_Capacity (kg/h). Note: Only input data fields (i.e. white) can be used here. |
| OutputUnitTag | Display | The Unit Operation Tag. For example: If the Output Tag is Plant_Feed.QmReqd (t/h), then the OutputUnitTag is Plant_Feed. |
| OutputValue / Output | Calc | The output value. |
| Buttons | ||
| Delete | Button | This allows the user to Delete the current individual waveform controller. Please note that there is no 'Undo'! |
| MoveUp | Button | This allows the user to increase the Priority of the current individual waveform controller. For example, if the current waveform controller is number 3, the user can change it to 2 or 1 by clicking on this button once or twice. |
| MoveDown | Button | This allows the user to decrease the Priority of the current individual waveform controller. For example, if there are 3 waveform controller in the unit and the current waveform controller is number 1, the user can change it to 2 or 3 by clicking on this button once or twice. |
Adding this Model to a Project
Add to Configuration File
Sort either by DLL or Group:
| DLL: | ControlDyn.dll |
→ | Units/Links | → | Control 2: Signal Waveform | |
| or | Group: | General |
→ | Units/Links | → | Control 2: Signal Waveform |
See Model Selection for more information on adding models to the configuration file.
Insert into Project Flowsheet
| Insert Unit | → | Control 2 | → | Signal Waveform |
See Insert Unit for general information on inserting units.


