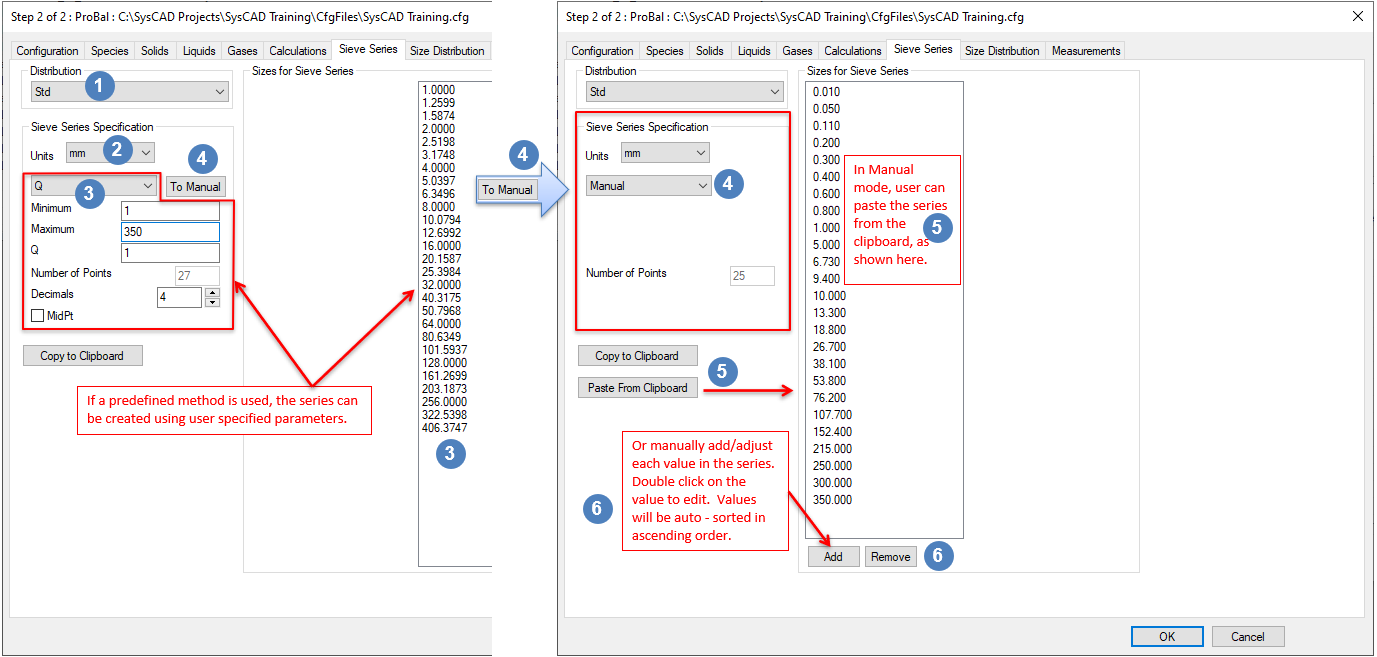
Sieve Series
Jump to navigation
Jump to search
Navigation: User Guide ➔ Edit ➔ Project Configuration (cfg File) ➔ Size Configuration ➔ Sieve Series
| Edit Configuration Step 2 of 2 - Size Configuration | |||
|---|---|---|---|
| Size Configuration (Summary) | Sieve Series | Size Distribution | Measurements |
Related Links: Size Distribution (PSD), Size Distribution Definition
Sieve Series
| Distribution |
Each Size Distribution has its own sieve series. If more than one Size Distribution is available, click on this list box to choose the correct size distribution for sieve series definition. | |
| Sieve Series Specification |
Units: |
You may change the default engineering units for the sieve series by using the Units list box. |
| Q |
Creates a series from the minimum and encompassing the maximum values based where the ratio between series is based on the following formulae:
| |
| Sqrt(2) | Each interval is √2 times previous interval. | |
| Ratio | Each interval is Ratio times previous interval. | |
| Arithmetic | Linear intervals separated by 'A'. | |
| Tyler Mesh | The full Tyler Mesh series. The user may truncate the series by adjusting the minimum and maximum values. | |
| US Mesh | The full US Mesh series. The user may truncate the series by adjusting the minimum and maximum values. | |
| To Manual | By clicking on this button the user transfers the series data to Manual and changes the specification type to Manual.
| |
| Minimum | The minimum value for the Sieve Series. NOTE: This is the upper value of the smallest size interval. The absolute smallest size possible (lower value of the smallest size interval) is "Bottom Size" defined on the Size Distribution tab page. The Bottom Size must be less than the Minimum value for the distribution. If the Minimum is set to a value equal to or lower than the Bottom Size, then the Bottom Size will be adjusted to half of the Minimum. | |
| Maximum | The maximum value used when determining the Sieve Series. Depending on the method, this may not be the upper value of the largest size interval. | |
| Number of Points | Displays number of Intervals. | |
| Decimals | For non-manual types you can specify 0-8 decimal places. | |
| Manual |
Allows the user to manually enter size intervals. | |
| Copy to Clipboard | This button copies the current sieve series onto the Windows clipboard, allowing it to be pasted into external programs such as Excel. | |
| Paste from Clipboard |
This button is only available if Manual is selected. It allows the user to copy a sieve series from an external program such as Excel and paste it into the sieve series box. | |
NOTES:
- For the smallest size interval the upper value is the smallest value in the sieve series and the lower value is not zero, it is defined by the user as "Bottom Size" on the Size Distribution tab page.
- When using size separation units, such as Screens and Hydrocyclones, the calculated efficiency curve is dependent on the user defined sieve series. Because efficiency curves are usually steep, it is recommended that the user defines as many size fractions around the cut-sizes of interest as possible.
- If the user wishes to use more than one sieve series in a project, then it is recommended that all of the sieve series have the same number of size intervals. This makes reporting and setting values simpler.
- Ctrl+C and Ctrl+V will not work in the sieve series box, use the Copy to Clipboard and Paste from Clipboard buttons instead.
