Belt Filter
Navigation: Models ➔ Mass Separation Models ➔ Belt Filter
| Disk Centrifuge | Drum Filter | Filter Press | Belt Filter | Batch Centrifuge |
|---|---|---|---|---|
| No wash | Combined Filtrate only | With 1 optional Washings | With 2 optional Washings | |
General Description
A Belt Filter is used for counter current filtration washing (CCFW). This technique enables the efficient recovery of the aqueous species in the feed liquor to the filtrate, with minimum losses to the liquor in the filter cake.
The techniques used to emulate the Belt filter with CCFW require the user to have data on filtration losses for Simple Filtration Washing (SFW), a wash loss curve.
Notes:
- If washing is included, then this unit must have 2 or more stages enabled to work correctly. If there are less than 2 stages of washing, the solid-liquid separation will still occur, but the wash water will have no effect.
- If the user does not have a Simple Filtration Wash loss curve or if washing is not required, then it is recommended to use one of the other filter models, for example the Filter Press or the Drum Filter.
- User without test data may set up a simple filtration wash loss curve using simple filtration washing (SFW) efficiency. Please see Hints and Comments for an example.
Diagram
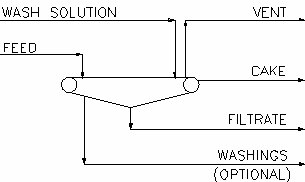
The diagram shows the default drawing of the Belt Filter, with all of the streams that are available for operation of the unit. The user does not have to connect streams to either the 'Wash Water' or 'Washings' connections.
The Belt Filter will operate without a connection to the Liquid Washings outlet. All of the wash solution from the belt filter will then report to the filtrate stream. This is NOT recommended - rather use one of the other filter units if there is no washing.
The physical location of the streams connecting to the Belt Filter is unimportant. The user may connect the streams to any position on the unit.
Inputs and Outputs
| Label | Required Optional |
Input Output |
Number of Connections | Description | |
| Min | Max | ||||
| Feed | 1 Required | In | 1 | 20 | The slurry feed to the Belt Filter |
| Wash Solution | Optional | In | 0 | 10 | Wash water to the Belt Filter - optional |
| Liquid Filtrate | Required | Out | 1 | 1 | Filtrate outlet from the unit |
| Solid Product (Cake) | Required | Out | 1 | 1 | Solids outlet from the unit |
| Liquid Washings | Optional | Out | 0 | 1 | Washings outlet from the unit - optional |
| Vent | Optional | Out | 0 | 1 | Vent Stream (Vapour only). |
Behaviour when Model is OFF
If the user disables the unit, by un-ticking the On tick box, then the following actions occur:
- The field MassFracToCake becomes visible and the user may set the fraction of the feed stream that reports to the 'Cake' outlet. The default is 100%.
- All streams connected to the 'Feed' inlet will flow out of the 'Cake' outlet, unless the user has changed the above field from 100%. In which case the user defined fraction of the Feed will report to the Filtrate stream;
- All streams connected to the 'Wash Solution' inlet will flow straight out of the 'Filtrate' outlet;
- Normally no mixing will occur. If the user sends some, or all, of the Feed to the Filtrate stream, then this will mix with the Wash stream.
So basically, the unit will be 'bypassed' without the user having to change any connections.
Model Theory
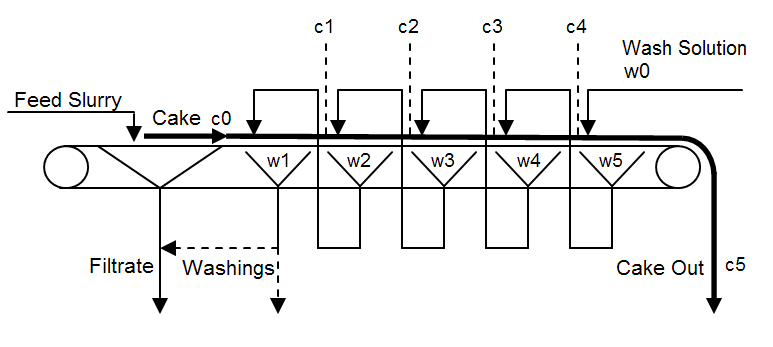
An example of a belt filter with five stages of counter current washing is shown in Figure 1 below:
Figure 1
The model will simulate a number of counter current washing steps, from 2 upwards. All of the wash water is assumed to be added to the final washing stage, with the filtrate from each stage being added as a wash to the previous stage. As the cake travels along the belt and is washed with progressively leaner wash liquor, it develops a concentration profile that varies from stage to stage. The average wash liquor concentrations and the cake concentration profile (for a given cake) are the same as those for a Simple Filtration Washing (SFW) system with the same wash liquor input.
For the belt filter with 5 stages shown in Figure 1 above, the concentration of the aqueous species in the liquor remaining in the cake exiting the belt, c5, can be calculated from:
- c5 = c4 - N * (w5 - w0)
- where:
- ci - the aqueous species mass concentration in cake moisture discharged from the ith stage.
- wi - the aqueous species mass concentration of washings collected in the ith stage.
- N - Mass Ratio of Wash Water used to the mass of liquor in the final cake.
The equations required to calculate the intermediate cake moisture and washings aqueous species concentrations, ci and wi, are described in the reference. All of these equations rely on both the value of N and the relationship between N and the fraction of liquor remaining in the cake.
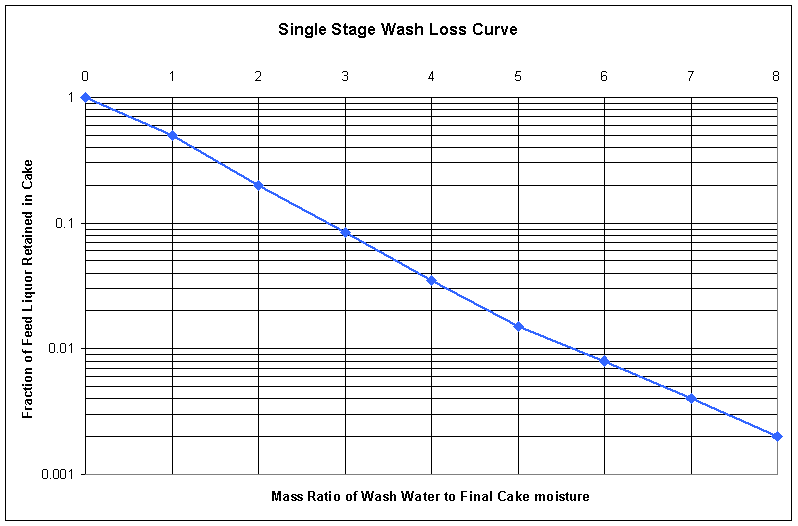
An example of this relationship is shown in the Simple Filtration Washing (SFW) Wash Loss curve in Figure 2 below:
Figure 2
This curve can be obtained from pilot plant or full-scale operation, or if necessary it can be determined from a laboratory test that simulates the expected plant conditions.
(Please see Wash Loss Section, in the Data Sections for help on entering data for SFW Wash Loss curve)
The model uses the above curve to determine the displacement of original feed liquid from the cake at each stage on the belt filter. As the cake travels along the belt it is washed with less and less concentrated wash water. The liquid remaining in the cake that is discharged from the belt is mainly wash water.
The mass of wash water that is sent to the belt filter is re-used n times, where n is the number of stages of washing. The Simple Filtration Washing (SFW) loss, li, at each stage is:
- [math]\displaystyle{ l_i = f (i * N) }[/math]
- where [math]\displaystyle{ f (i * N) }[/math] - is obtained from the Wash Loss curve.
So, for the above example with:
- 5 stages of washing; and
- A mass ratio of wash water to cake moisture N = 1.5
The following SFW losses can be read from the Wash Loss curve in Figure 2:
Stage (i) i * N SFW Loss (f(iN)) 1 1.5 0.32 2 3 0.085 3 4.5 0.022 4 6 0.008 5 7.5 0.003
NOTES:
- The Wash Water to Final Cake moisture mass ratio, N, is displayed in the Belt Filter access window in SysCAD as WashRatio.
- When using this model the user must specify at least 2 wash stages.
- In the above example, with a Wash Water to Final Cake moisture ratio of 1.5, and 5 stages, the user must have a value for the Ratio (X-axis) of at least 7.5 for the simple wash loss curve. If the curve entered into SysCAD does not have a value for the Ratio of at least 7.5, e.g. the highest value was 5, then the model would give the user a warning: SFW wash loss 7.5 is out of user specified range of data points (0 to 5)
- User without test data may set up a simple filtration wash loss curve using simple filtration washing (SFW) efficiency. Please see Hints and Comments for an example.
Assumptions
- Ideal displacement washing is assumed, i.e. mass of liquid phase hold-up in the cake is constant throughout the washing process.
- No solids are lost to the filtrate.
Reference
- Tomiak, Predict performance of belt filter washing, Chemical Engineering, April 23, 1979
Note: The original paper uses volumetric concentrations to calculate the displacement of solutes from the solids moisture to the wash liquor. However, this assumes a constant liquor density, which is not always valid. Therefore, the model uses Mass concentrations, or ratios, to calculate the relative amounts of solutes in the exit streams from the belt filter.
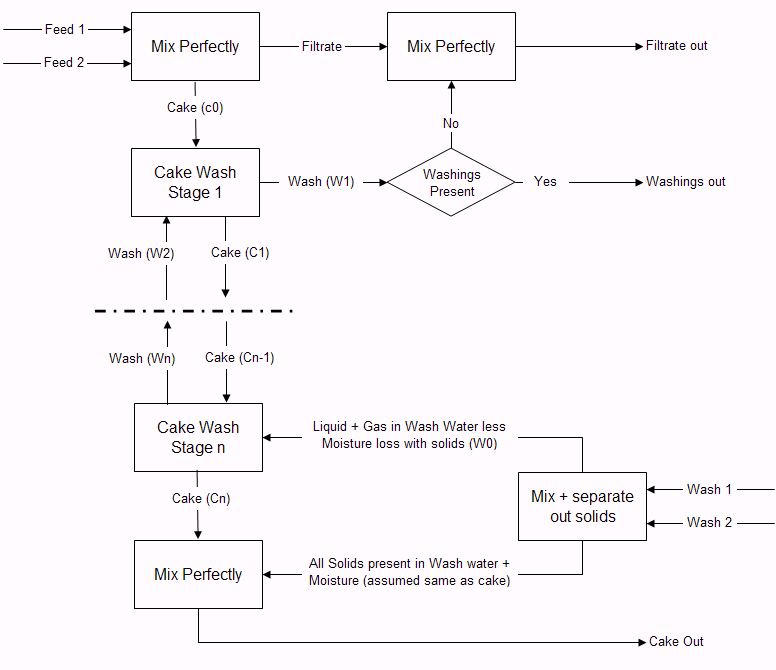
Flowchart
Data Sections
The default sections and variable names are described in detail in the following tables. The default Belt Filter access window consists of 3 sections. This number may increase or decrease, based on user configuration.
- BeltFilter tab - Contains general information relating to the unit.
- WashLoss tab - Enables the user to enter the data for the simple filtration washing curve.
- QCake - Available from Build 139. Optional tab, visible if ShowQCake is enabled. This and subsequent tab pages, e.g. QCake.. and Sp, shows the properties of the Cake stream. The tags in the QCake tab are valid even when the ShowQCake option is not selected.
- QFiltrate - Available from Build 139. Optional tab, visible if ShowQFiltrate is enabled. This and subsequent tab pages, e.g. QFiltrate.. and Sp, shows the properties of the Filtrate stream. The tags in the QFiltrate tab are valid even when the ShowQFiltrate option is not selected.
- Info tab - Contains general settings for the unit and allows the user to include documentation about the unit and create Hyperlinks to external documents.
- Links tab, contains a summary table for all the input and output streams.
- Audit tab - Contains summary information required for Mass and Energy balance. See Model Examples for enthalpy calculation Examples.
Belt Filter Page
Unit Type: BeltFilter - The first tab page in the access window will have this name.
| Tag (Long/Short) | Input / Calc | Description/Calculated Variables / Options |
| Tag | Display | This name tag may be modified with the change tag option. |
| Condition | Display | OK if no errors/warnings, otherwise lists errors/warnings. |
| ConditionCount | Display | The current number of errors/warnings. If condition is OK, returns 0. |
| GeneralDescription / GenDesc | Display | This is an automatically generated description for the unit. If the user has entered text in the 'EqpDesc' field on the Info tab (see below), this will be displayed here. If this field is blank, then SysCAD will display the UnitType or SubClass. |
Requirements | ||
| On | Tick box | Switch the model on or off. If the unit is 'Off' then by default all Feed reports to cake solids outlet and all wash streams report to filtrate. If user specifies a value (less than 100) in the MassFracToCake field, then some feed may report to the filtrate stream. |
| MassFracToCake_WhenOff / MassFracToCake | Input | This field becomes visible when unit is switched off. User may set the fraction of the feed stream that reports to the 'Cake' outlet. The default is 100%. |
| Stages | Input | The required number of washing stages on the belt filter. The user MUST specify at least 2 stages if washing is desired (i.e. if a wash solution stream is connected). |
| CakeMoistReqd | Input | The required percentage liquid in the washed cake, the final cake moisture. This must be between 0.01% and 99%. |
| OperatingP - NOTE: this pressure is applied to the (combined) feed, before sub-models (if any). | ||
| Method | AutoDetect | If there are any liquids AND no vapours present in the feed, outlet streams will take the highest pressure of the feeds. Else (e.g. some vapours present) outlet streams will take the lowest pressure of the feeds. |
| LowestFeed | Outlet streams will take the lowest pressure of the feeds. | |
| HighestFeed | Outlet streams will take the highest pressure of the feeds. | |
| Atmospheric | Outlet streams will be at Atmospheric Pressure. The atmospheric pressure is calculated by SysCAD based on the user defined elevation (default elevation is at sea level = 101.325 kPa). The elevation can be changed on the Environment tab page of the Plant Model. | |
| RequiredP | Outlet streams will be at the user specified pressure. | |
| IgnoreLowMassFlow / IgnoreLowQm | Tick Box | This option is only visible if the AutoDetect, LowestFeed or HighestFeed methods are chosen. When calculating the outlet pressure and temperature of the tank, SysCAD will ignore the low flow feed streams should this option be selected. The low flow limit is set in the field below. |
| LowMassFlowFrac / LowQmFrac | Input | This field is only visible if the IgnoreLowQm option is selected. This is the amount any stream contributes to the total flow. For example, if the total feed to the tank is 10 kg/s, and this field is set to 1%. Then any feed streams with less than 0.1 kg/s will be ignored in the pressure calculations. |
| PressureReqd / P_Reqd | Input | This field is only visible if the RequiredP method is chosen. This is user specified pressure. |
| Result | Calc | The actual pressure used for the sum of the feeds which will also be the outlet pressure (unless further model options change the pressure). |
| Options | ||
| ShowQCake | Tickbox | Available from Build 139. When selected, the QCake and associated tab pages (e.g. Sp) will become visible, showing the properties of the Cake stream. See Material Flow Section. Tags in the QCake tab can be used for controllers (e.g.: PGM files) and reports even when this option is not selected. |
| ShowQFiltrate | Tickbox | Available from Build 139. When selected, the QFiltrate and associated tab pages (e.g. Sp) will become visible, showing the properties of the Filtrate stream. See Material Flow Section. Tags in the QFiltrate tab can be used for controllers (e.g.: PGM files) and reports even when this option is not selected. |
| TrackStatus | Tick Box | Enable warning messages if requirements are not met. |
Results | ||
| WashRatio | Calc | The calculated wash ratio, N, on the Belt filter. Mass Ratio of Wash Water to Liquid in Cake. |
| SolidsWashRatio / SolWashRatio | Calc | The calculated ratio of Wash Water to Solids in the feed to the Belt Filter. |
| WashEfficiency / WashEff | Calc | The calculated overall wash efficiency of the Belt Filter - this is the efficiency of feed liquor removal from the cake. For example, if 10% of the Feed liquor remains in the cake, then the Wash Efficiency = 100 - 10 = 90%. |
| FracFeedLiquorinCake / FracFeedInCake | Calc | The fraction of feed liquor remaining in the cake from the Belt Filter. |
| Cake.SolidFrac / Cake.Sf | Calc | Displays the fraction of solids in the final Cake from the Belt Filter. |
| Cake.SolidConc25 | Calc | Displays the concentration of solids in the final Cake from the Belt Filter at 25°C. |
| Filtrate.SolidFrac / Filtrate.Sf | Calc | Displays the fraction of solids in the filtrate from the Belt Filter. |
| Filtrate.SolidConc25 | Calc | Displays the concentration of solids in the filtrate from the Belt Filter at 25°C. |
WashLoss Section
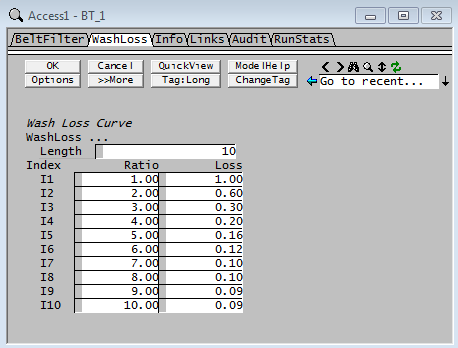
The user types in the x (Ratio) and y (Loss) values for the Simple Filtration Washing (SFW) wash loss curve. The user must go to the 'WashLoss' tab of the access window to enter this data. Figure 3 below shows an example of data entered for a SFW wash loss curve (this data corresponds to the curve shown in Figure 2 in the Theory section). For users with no wash loss curve, please see Hints and Comments for example on how to create a curve based on SFW efficiency.
Figure 3
- The number of points in the SFW wash loss curve, Length. In this example it is 10.
- Wash Loss Curve Ratio data points are expected to increase in value from the first data point to the last data point entered.
- Units can be specified in the curve. See an example file for details.
| Tag(Long/Short) | Input / Calc | Description |
|---|---|---|
| Wash Loss Curve | ||
| WashLoss... | ||
| The user enters the data points in the two columns on this page. The model interpolates linearly between the points and extrapolates beyond the first and last points. | ||
| Length | Input | The number of data points. Once a number has been typed in, the Ratio and Loss columns will be visible with the required number of lines. If the data is loaded from a predefined file, the length will be automatically set to match the file length. |
| Data Points | Index | The data point index value |
| Ratio | The Wash Ratio for the Wash Loss Curve. (This is the wash ratio x number of wash stage) | |
| Loss | The Wash Loss value for the Wash Loss Curve. (This usually comes from test data, if test data is not available, can be estimated based on required wash efficiency, please see Hints and Comments for more information.) | |
| The Wash Loss data can be saved to or loaded from a file. | ||
| FileName | Input | User specified filename, (1) to store current screen values or (2) load pre-defined values. The file should be in a CSV (comma delimited) format. |
| Folder | Feedback | When saving the data to a file, the default folder will be the current project folder unless specified otherwise by the user. |
| Edit | Edit Button | This will open the wash loss data CSV file (as entered on in the FileName field) for editing. If no filename has been specified, pressing this button will open a new XXXX.csv file for editing. XXXX is the name of the current unit operation. |
| Reload | Load Button | Only active if FileName is not empty. This will load the data points from the CSV file, replacing the current values. |
| Save | Save Button | Only active if FileName is not empty. This will save the current values to the CSV file. |
| Browse | Browse Button | Use the "Browse" button to locate the CSV file that contain the wash loss data. |
Adding this Model to a Project
Add to Configuration File
Sort either by DLL or Group:
| DLL: | Separation.dll |
→ | Units/Links | → | Separation: Filter - Belt Filter | |
| or | Group: | Mass Separation |
→ | Units/Links | → | Separation: Filter - Belt Filter |
See Model Selection for more information on adding models to the configuration file.
Insert into Project Flowsheet
| Insert Unit | → | Separation | → | Filter - Belt Filter |
See Insert Unit for general information on inserting units.
Hints and Comments
1) User with no wash loss data may use the following values based on "Single Filtration Washing efficiency" (SFW)
- Please note that this is not the overall wash efficiency displayed in the Belt filter, but the wash efficiency per stage using liquor displacement, as per the Filter Press Model.
- Ratio must cover the wash ratio x number of stages. For example, if the wash ratio is 3, number of stage is 2, then Ratio specified must be > 6, if not, SysCAD will give a warning.
Index Ratio Loss comment I1 0 1 This is equivalent to no washing I2 1 0.15 (100 - SFW) / 100. This is the wash using the fresh wash water, if SFW efficiency is 85%, and the wash ratio is 1, then 0.15 (fraction) of cake liquor will remain in the cake. I3 2 0.0225 Power[(100 - SFW) / 100), 2]. Cake has been washed twice, if SFW efficiency is 85%, and the wash ratio is 1, then 0.15*0.15 = 0.0225 (fraction) of cake liquor will remain in the cake. I4 3 0.003375 Power[(100 - SFW) / 100), 3]. Cake has been washed three times, if SFW efficiency is 85%, and the wash ratio is 1, then 0.15*0.15*0.15 = 0.003375 (fraction) of cake liquor will remain in the cake.
2) User may set up a General Controller (PGM file) to adjust the wash loss values based on user-specified SFW Efficiency, see Example PGM File - Estimate Belt Filter Wash Loss Curve based on Washing Efficiency.
3) User may also add a PID to adjust the SFW Efficiency to achieve a required Overall washing efficiency (as displayed on the BeltFilter Tab). See Example PGM File - Estimate Belt Filter Wash Loss Curve based on Washing Efficiency - for example PGM logic.
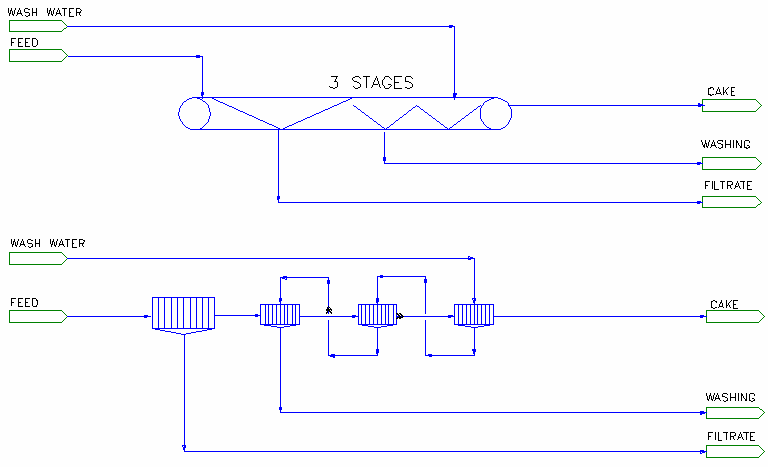
4) The following two simulation circuits are equivalent:
- Belt Filter 3 stages using the above wash loss curve, based on single wash efficiency of 85% per stage, and
- Filter press emulating the belt filter operation, using washing efficiency of 85% in each wash stage.
Example Project
Please see Nickel Copper Project
