Template:Status Bar
Jump to navigation
Jump to search
This is shown on the bottom of the main SysCAD window. It is divided into a number of sections. The large section (Left-hand side) is used to display SysCAD status, commands or FlyBys. (See General Options Toolbars)
The area on the right is shown here:
SysCAD in Edit Mode:
Running in Steady State:
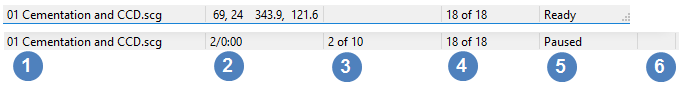
Running Dynamic Simulation:


displays the active window, in this case the Graphics Window. 
displays different information depending on the current operation. - if SysCAD is stopped and the mouse cursor is pointed on a Graphics Window, the number displayed is the position of the pointer.
- if SysCAD is running a Steady State simulation, it shows the number of iterations executed and time taken. For example "70/0:01.898" means the simulation has gone through 70 iterations and spent 1.898 seconds so far to solve the model. These values correspond to tags PlantModel.Stats.Iterations and PlantModel.Stats.SolveTime.
- if SysCAD is running a dynamic simulation, the number shown will represent the time span for which this project has been simulated.

Display different information depending on SysCAD solver mode. - Steady State simulation: Shows the maximum error for convergence. This correspond to the value shown in Solver Status window. When the Max Error value is < 1.0 all the Criteria are considered converged (model is "solved"). The number of significant digits is based on the global relative tolerance specified. This value corresponds to tag $Solver.Convergence.Error.[Worst].Max.
- Dynamic Simulation: Shows the step size.

Display different information depending on SysCAD solver mode. - Steady State simulation: Shows Number of criteria solved. For example "7 of 10" means 7 of the 10 criteria for convergence have been met. These values correspond to Solver Setting - Convergence tags $Solver.Convergence.Criteria.Active and $Solver.Convergence.Criteria.Done.
- Dynamic Simulation: There are three possible displays: S (steps), I (iterations) and B (Bad Step). These values correspond to Solver Setting - Convergence tags $Solver.Convergence.Steps, $Solver.Convergence.Iterations and $Solver.Convergence.Steps.Bad. See comments below for further information.

Display the SysCAD State. See Plant Model - States - AppState and AppState.Detail for full list of states. These states are also available as special tags for OPC. 
If script commands are currently being executed, an additional pane showing the number of script commands to be executed will be shown.