Quick View Data Report
Jump to navigation
Jump to search
Navigation: User Guide ➔ Reports ➔ Excel Reports ➔ Quick View Data Report
| Excel Automation | Export Reports | Import Data | Trend Data | Information Report | |||
|---|---|---|---|---|---|---|---|
| Excel Report Summary | Adding | Executing Report | Get Tag Report | Tag Select Report | Quick View Report | Set Tag Report | Trend Report | General | Species Info |
Latest SysCAD Version: 25 February 2025 - SysCAD 9.3 Build 139.37016
Related Links: Quick View
Copy Data for Excel Reports
Please also see ETip: Quick View Excel Report Template.
The Quick View can also be used to quickly copy either:
- Lists of variables, Qo.Qm, Qo.Qv, Qo.T, etc. to Excel; or
- A table with units and variables to SysCAD.
List of Variables
- The 'Copy to Clipboard' button in the Quick View Editor window (described in Editing Quick View Window ) allows you to copy the list of variables to Excel as the basis of a report.
- This will also automatically insert a Tag_Select key word that will allow you to then generate a report for ALL units in the project.
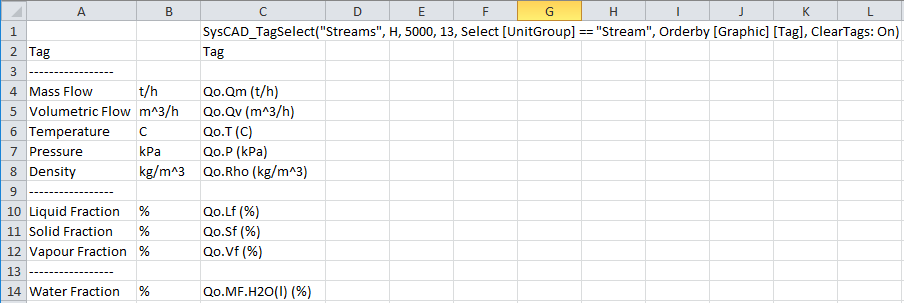
- The Excel report shown below was generated from the Quick View editor window shown above:
Notes:
- The Labels and Separators are copied into the Excel report.
- The SysCAD_TagSelect statement is set up for the unit type in the Quick View window, in this case Pipes, or streams.
- When you generate this report from SysCAD it will report the selected variables for ALL of the pipes in the project.
- Please see SysCAD Tag Select Reports for more information on this type of report.
Table of Units and Variables
The user may quickly set up an Excel stream report for a flowsheet:
- Create a Quick View window with the pipes that you want in a report, as shown above (described in Multiple Units Quick View).
- Note: You may select units across multiple flowsheets.
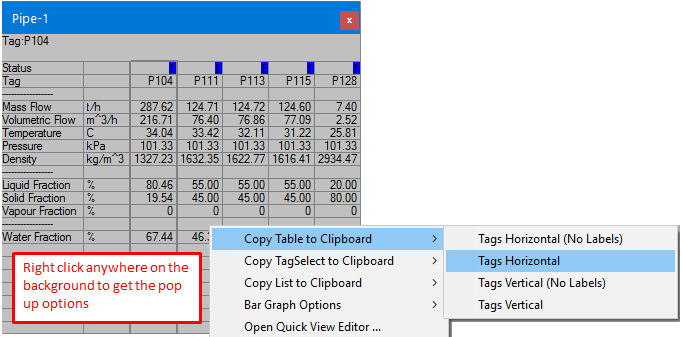
- Right click anywhere in the Quick View window and select 'Copy Table to Clipboard'
- You may then select to copy the primary tags - the units, in this case pipes - either Horizontally or Vertically.
- If you select 'Tags Horizontal (No Labels)' or 'Tags Vertical (No Labels)' then the Label column (the one on the left) will not be copied.
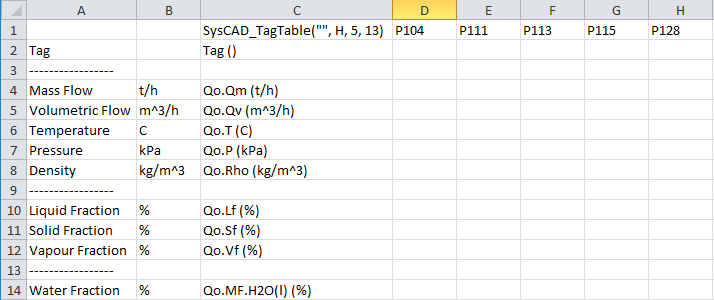
The example below shows the table generated in Excel from the above Quick View with 'Tags Horizontal' selected:
- The Labels are copied into Column A and the conversion units into Column B. (If the 'No Labels' option is selected, neither of these columns would be copied)
- The report key word SysCAD_TagTable("",H,5,13) is automatically generated. You may insert a report name (it is not necessary).
- You may now generate a SysCAD report in Excel.
- Please see SysCAD Report in a Table for more information on Excel reports.


