Default Reports
Navigation: User Guide ➔ Getting Started ➔ Example Projects ➔ Default Reports
| Example Reports | ||||
|---|---|---|---|---|
| Project Report | Flowsheet Report | Project Criteria Report | Sensitivity Analysis | Default Reports |
Related Links: Excel Reports
Default Reports
Report Template
- Two Report templates are distributed with the SysCAD install, these can be found in the folder ..\SysCADxxx\BaseFiles\TemplateReports
- SteadyStateGeneral.xlsx : Contains a basic stream report, an overall mass balance and a report on reaction blocks.
- SteadyStateDetailed.xlsx: Contains detailed report about the project.
Default Reports
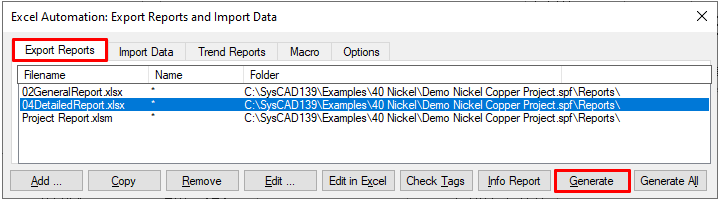
- For every project, two reports can automatically be created in the project Reports folder:
- 02GeneralReport.xlsx, created using the SteadyStateGeneral.xlsx template.
- 04DetailedReport.xlsx, created using the SteadyStateDetailed.xlsx template.

- Prior to Build 139.32925 these report files are automatically created when the Excel Automation Dialog is opened. From Build 139.32925 they are only created when first generated or edited in Excel.
- These two reports can be used by any project, the 04Detailed report needs minor input from the user, please see What is included in the 04 Detailed Report for notes.
Updating Default Report with Template Changes
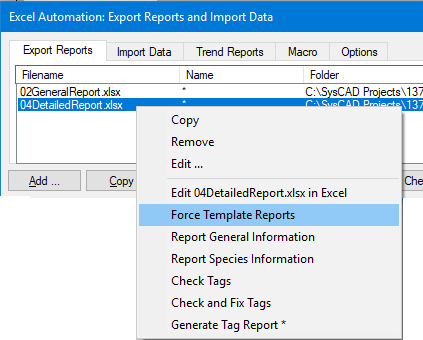
- If user has changed the template and would like to re-create the default report using the updated template, then with the Excel Automation dialog open, right click to bring up the pop up list, and select Force Template Reports.
- NOTE: make sure the report is closed before replacing the report.

What is included in the 02 General Report
- This report contains a basic stream table and mass balance page, can be used for a quick mass check.
- The stream tables in this report display only basic properties and stream data by default.
- Users can customise any of the SysCAD reports in the workbook to include additional properties and species data.
- See How to customise the stream tables for more information.

What is included in the 04 Detailed Report
- The 04DetailedReport include a list of worksheets, as shown in the following picture. The Document tabs can be access from the "Main" worksheet.
- The report also includes elemental balance of 4 elements, please set the elements on the "Select Elements" worksheet before generating the report.
- The "Stream Table (H)" and "GraphicsPages" worksheets need an initial run to generate the number of flowsheet field, or user can set these values before the initial run, otherwise run the report again to populate the tags.
- The stream tables in this report display only basic properties and stream data by default.
- Users can customise any of the SysCAD reports in the workbook to include additional properties and species data.
- See How to customise the stream tables for more information.
- Some tables in this report uses conditional formatting, to make a change: MS Excel - Conditional Formatting - and choosing “Manage Rules”.

How to customise the stream tables
You can insert, delete, or rearrange any existing data in the stream table—it's fully customisable to suit your needs.
Example: Adding H₂SO₄(aq) Mass Flow to the "Stream Table H" Report (as shown in 02 General Report)
- Expand the Outline: Open the outline to Level 2 to reveal the variables column.
- Copy the SysCAD Tag:
- In SysCAD, locate the species variable in a stream.
- Right-click on the variable and select "Copy Tag".
- Paste into Excel
- Switch back to Excel and paste the tag into Cell E23.
- Example:
Qo.QM:Ph.H2SO4(aq) (t/h)
- Add Descriptions (Optional): You may enter descriptive text in Columns B to D for clarity and presentation.
- Repeat for Additional Variables: Follow the same steps to add any other variables you wish to include.
- Update the Report Keyword:
- After adding all variables, count the total number of entries.
- Compare this count to the Max Column value in the SysCAD report keyword.
- If you've added more than the current maximum (e.g., 30, highlighted in yellow), update the keyword accordingly. Otherwise, excess variables will not be processed.
After updating the SysCAD report format, regenerate the report in SysCAD to ensure the stream tables are refreshed and include the newly added variables.

For detailed instructions on adding SysCAD tags and variables to reports, refer to the section Adding SysCAD Tags and variables to the reports.
For users familiar with Python, refer to the Python Script for Generating Species Variable Tags to automatically generate species tags for inclusion in stream table reports.