Planning Example Project
Navigation: User Guide ➔ Dynamic Example Projects ➔ Planning
Project Location
This is a Dynamic Transfer project and is stored at:
..\SysCADXXX\ExamplesDynamic\Planning Example.spf
Features Demonstrated
- Use of Profile to add feed at variable rates over time.
- Use of Waveform Controller to vary feed rates over time using geometric patterns.
- Use of Queue Profile + General Controller logic to ship out the required products.
- Use of Noise Controller to vary plant feed rates.
- Use of the General Controller Logic for Cost / Revenue analysis.
- Use of the General Controller Logic to set equipment limitations.
- Use of a Multi-Storage unit operation to store the different products.
- Use of a Conveyor Belt unit operation to transfer material.
- Use of Material Tracking to track source of ore in final product.
- Use of the Archive Reporter to report results at regular intervals.
Brief Description
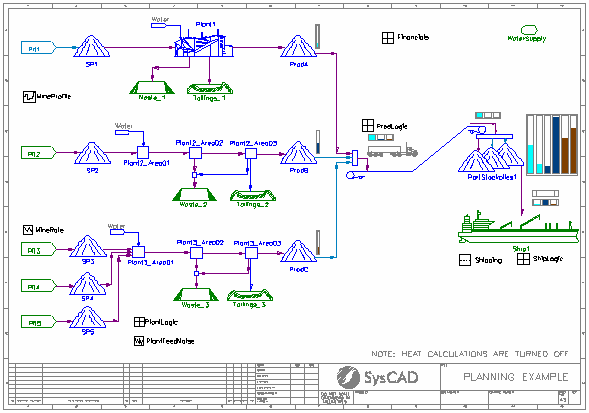
This is a simple material transfer project demonstrating how to handle product storage, shipping and production planning issues.
Material is sourced from 5 different locations producing 3 different products. These products are stored in the PortStockpiles to wait in queue to be shipped away to customers. User can use the results from Financials (General Controller) to plan for the best production ratio to maximise profit.
Material Tracking has been enabled so that the contribution of ore from each of the 5 pits to the products can be reported.
The Archive Reporter has been enabled and several tables have been defined to report results at regular intervals. The results are saved in csv files.
Project Configuration
- Total ore feed rates from Pit1 and Pit2 are varied by the MineProfile Profile model. The ore from Pit1 and Pit2 is feed to stockpiles SP1 and SP2, respectively, both modelled as Tanks.
- Total ore feed rates from Pit3, Pit4 and Pit5 are varied by the MineRate Waveform Controller model. The ore from Pit3, Pit4 and Pit5 is feed to stockpiles SP3, SP4 and SP5, respectively, all modelled as Tanks.
- The PlantLogic General Controller uses a PGM Class to determine and set the feed to each of the three process plants. In some cases, this is via the PlantFeedNoise Noise Controller. The plant feed is stopped if:
- Plant maintenance is required
- Plant equipment fails
- Feed stocks are too low
- Product stocks are too high
- Each process plant has 3 outlets, a solid product, a waste product and a tailings stream. The process plants are modelled as Ties and use the SplitFlows option to separate the material to different outlets.
- Each process plant has a water addition via a Makeup Block. The amount of water added is based on a set ratio of kg water per tonne of plant feed.
- Plant 1 is modelled as a single unit with 3 outlets. Plants 2 and 3 are divided into 3 areas:
- Area 01 has a single outlet. It combines the plant feed and includes the process water addition step.
- Area 02 has two outlets, a waste product and an intermediate product stream.
- Area 03 has three outlets, the final solids product, a waste product and a tailings stream. The waste streams from Areas 02 and 03 are combined into a single waste stream for each plant.
- The final solid products produced by the Plant1, Plant2_Area03 and Plant3_Area03 are fed to stockpiles ProdA, ProdB and ProdC, respectively, all modelled as Tanks.
- The ProdLogic General Controller determines which of the three products (A, B or C) should next be sent to the port stockpiles via an overland conveyor, which is modelled as a Conveyor Belt. This is based on stocks at plant and port for each product. Only one product is sent at a time on the conveyor. Once selected, the same product is loaded onto the overland conveyor until a predetermined amount has been sent to the port.
- The Port Stockpiles are modelled as a Multi-Storage unit with 6 separate stockpiles, 2 for each product. The selection of which of the two possible stockpiles to feed for each product is made randomly by the ProdLogic controller.
- The ShipLogic General Controller determines which of the three products (A, B or C) should next be loaded onto the ship. This is based on amount of each product which is required for each shipment. Only one product at a time is loaded onto the ship. Once selected, the same product is loaded onto the ship until the predetermined amount has been loaded. The amounts of each product required for each shipment are stored in the Shipping Queue Profile model. This model has 1 set of data for each ship. Once a shipment is completed, the queue profile sends the next set of data to the ShipLogic controller.
- The Financials General Controller uses a PGM Class to calculate production costs and revenue for each of the three products produced. It also calculates other associated costs such as water, conveying and ship loading. These values are used to calculate a total cost, total revenue and overall profit.
- The Archive Reporter is used to report results on an hourly basis including:
- Stockpile levels
- Product produced from different pits
- Costs, revenue and profit
Excel Report
- Port Demo Model Front End.xls - allows the user to run SysCAD via Excel.
- Output Results and Graphs.xls - contains macros which reads and graphs the archived results (saved in csv files) of the model run.
