Checking Data Consistency
Jump to navigation
Jump to search
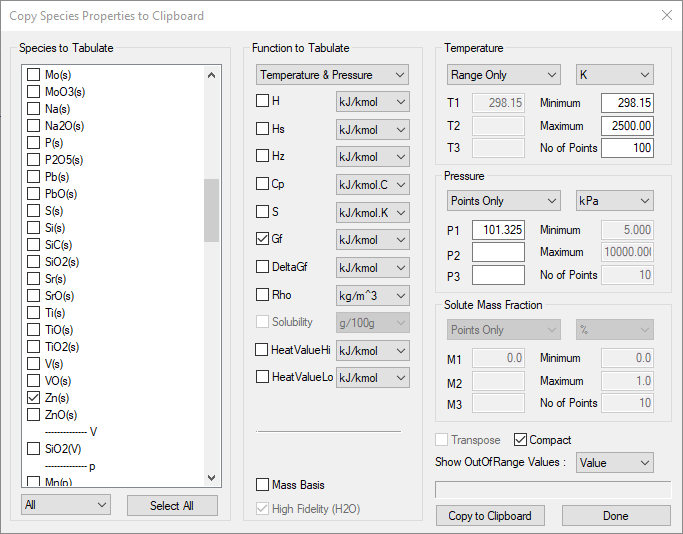
The Species Properties Reports in the Species Data offers a convenient way to check the thermophysical data consistency.
- Select all the components (solid, liquid, vapor) of a particular species. Here we select Zn(s), Zn(l) and Zn(v)
- Select Gf as the Function to Tabulate
- Pick a temperature range greater than the expected boiling point of the species.
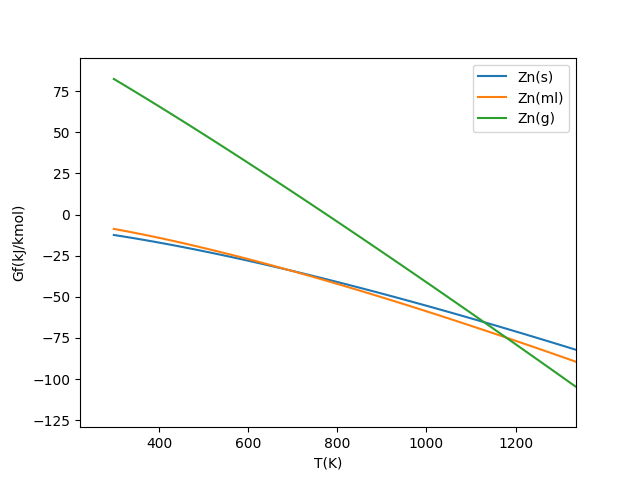
- Copy the data to the clipboard, and paste to Excel. You can examine the data manually, but it is easiest to just create plots of Gf vs T so you can immediately see if the data is inconsistent. (This can be easily done in Excel or use any other plotting app)
- At low temperatures the solid species should have the lowest free energy (Gf)
- At some point close to the melting point for the species, the curves for solid and liquid should intersect
- Between this point and the boiling point the liquid (in this case molten) curve should be the minimum,
- The curves for the liquid and vapor components should intersect near the boiling point.
- At large values of temperature, the vapor curve should be the minimum
In this example, the melting point of Zinc is 692K, and the boiling point is 1180K, and the intersection points of the curves are close to these values.

