Example SysCAD Excel Reports
Jump to navigation
Jump to search
Navigation: User Guide ➔ Getting Started ➔ Example Projects ➔ Example Excel Reports
| Example Reports | ||||
|---|---|---|---|---|
| Project Report | Flowsheet Report | Project Criteria Report | Sensitivity Analysis | Default Reports |
Related Links: Getting Started, Excel Reports
File Location
This file is stored in ..\SysCADXXX\Examples\01 Reports\Project Report.xlsm
Brief Description
This is an example project report created for the Nickel Copper Project. It shows some possible report layouts to best present SysCAD data. The report layout maybe used as a "template" for user reports. Many of the worksheets only require minor changes to work with other projects.
This file contains a number of report types, these include:
- Macro to Start SysCAD from Excel using COM Automation. Please see "Main" Tab.
- Set Tag List Report - Used to set a list of user specified values from Excel to SysCAD. Please See "Criteria" Tab, Column G.
- Tag List Report - Used to retrieve data from SysCAD into Excel as a list. Please see "Criteria" Tab, Column D.
- Tag Table Report - Used to retrieve data from SysCAD into Excel as a table. Please see Tabs Streams, as well as the individual flowsheet tabs.
- Excel Tag Select Reports - Used to retrieve data from SysCAD into Excel as a table. Please see Mass Balance tab.
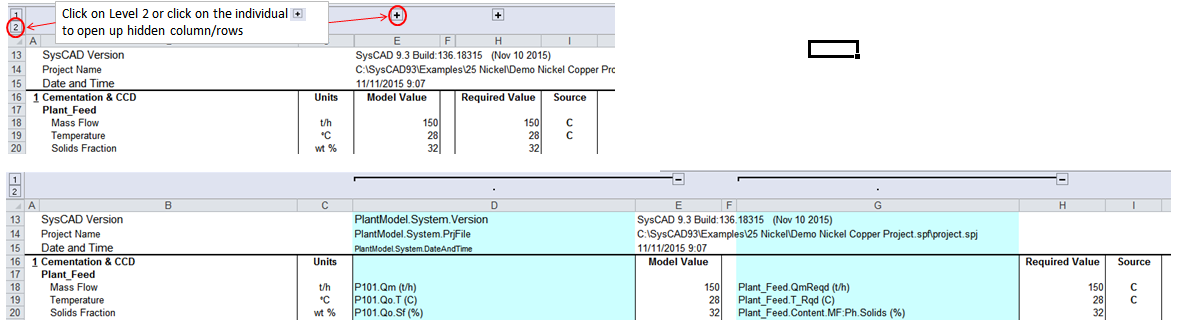
- NOTE that the example SysCAD reports may have the SysCAD Tag columns/rows hidden by outline. Please open these up to see the hidden columns/rows, as shown below:

Excel Worksheet Tabs
Main
- This worksheet contains an Excel Visual Basic Code to run SysCAD from Excel.
- The macro will load the Demo Nickel Copper Project, sets the project with the criteria input values, solves the project, then retrieves the model values from SysCAD.
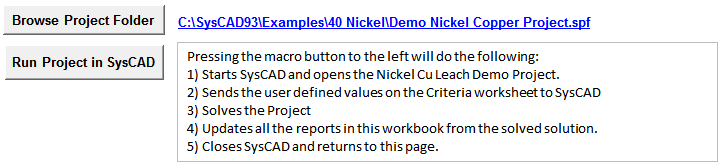
- This macro allows the end user not familiar with SysCAD to use the software run scenarios, where user changes some input values in Excel and views the SysCAD results after the run has completed.
- NOTES:
- User may need to register COM Automation before this macro can be executed correctly.
- Make sure the project file path is correct.

Criteria
- This worksheet REQUIRES USER INPUT. The aim of this worksheet is to list the key process indicators, or design criteria for the SysCAD model.
- Please see Project Criteria Report for how to edit this worksheet.
Mass Balance
- This report is created using tag select, which means the SysCAD Tags will update to match the pre-defined criteria. In this case, the report will search the SysCAD project to return all Feeders and Sinks (excluding cross page connectors) in the project to check for total in and total out mass balance.
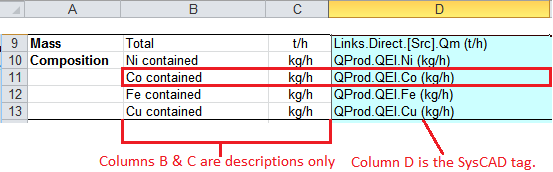
- The SysCAD Tags are located on Column D. Columns B and C are description only.
- This report will work with any project, user may need to modify the elemental balance to suit their project. For example: If your project has no elemental Co but would like to check elemental Al, then Change All Co to Al in columns B and D.

- NOTE: If mass does not balance, it could be due to left over tags from previous in the report. Check for the <<End>> Marker in Rows 8, 15, 32 and 37. The <<End>> markers indicate the end of the TagSelect query, if there are more than one <<End>> in a single Row, then delete the entries after the first <<End>>.
BFD
- This is described in Flowsheet Report Example.
Stream Report
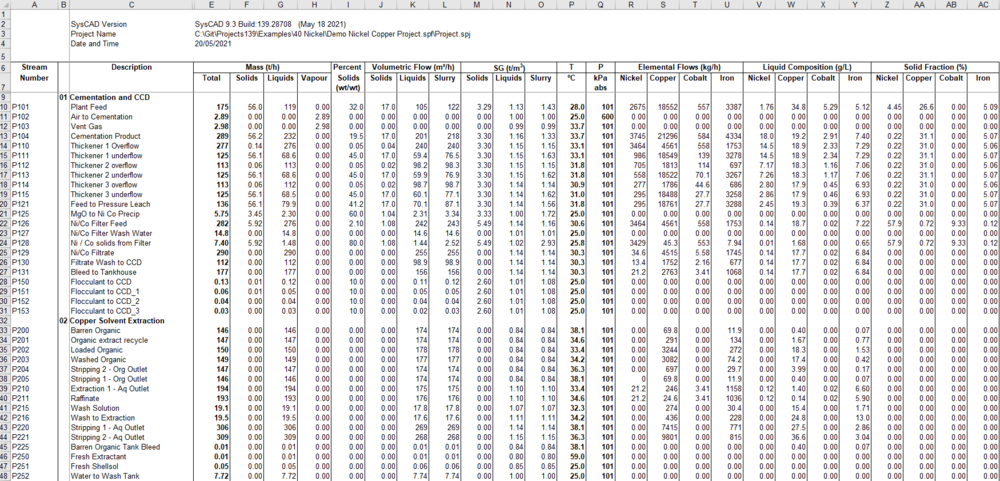
- There are two reports on this page, Cell A8 (for stream report) and D1 (for project information).
- The stream report (A8) is created using tag select, which means the SysCAD Tags will update to match the pre-defined criteria.
- This report has also been sorted by Graphics page.
- This report will work with any project, user may need to modify the elemental balance to suit their project. For example: If your project has no elemental Co but would like to check elemental Al, then Change All Co to Al in row 7 & 8.

Individual Flowsheet Tabs
- These reporting pages contain:
- SysCAD flowsheet - Flowsheets can be copied by using the Copy bitmap command. Alternatively, user can use MS Windows Snip & Sketch
 application to make a copy of the flowsheet.
 - Cell A2 has Data Validation setup, user can select from the list a variable to display on the flowsheet. Indicated by

- The values being displayed are from Excel Lookup, which are set up on Row 49. For example, Cell D49 has the following VLookup set up:
- The results from the VLookup are displayed in text boxes , as shown below.
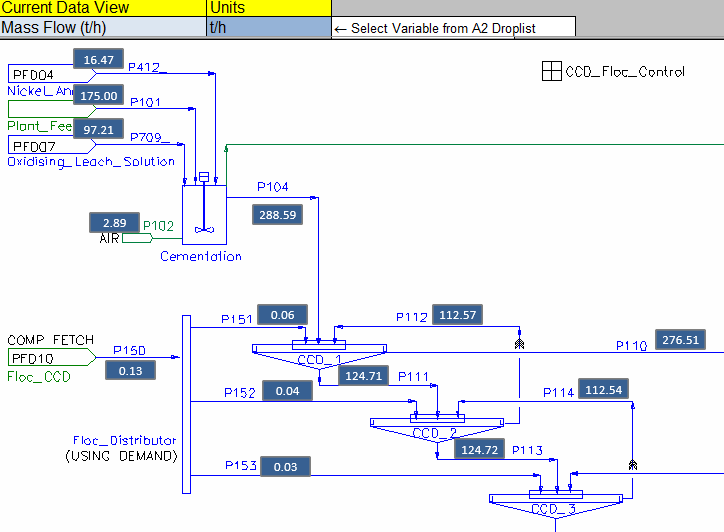
- Hint: To place the text box to the right location, change the variable selection (A2) to "Stream Number", this will make stream matching much easier.
- The SysCAD Report Table are hidden by outline, Rows 50 to 75. Change the reporting tag / or reporting variables in rows 50 to 75 if required to suit your project.
- SysCAD flowsheet - Flowsheets can be copied by using the Copy bitmap command. Alternatively, user can use MS Windows Snip & Sketch


