Species Properties Reports
Navigation: User Guide ➔ Menu Commands ➔ Species ➔ Species Properties ($SDB) ➔ Species Properties Reports
| Main | Editing User Species Database | Species Database Data Table - Theory and Equations | Viewing Properties | |||||||||
|---|---|---|---|---|---|---|---|---|---|---|---|---|
| Species Database | Editing User Species Database | Importing data into Species Database | Species Table | Heat of Formation and Entropy | Density | Specific Heat (Cp) | Phase Change (solubility) | BPE & Acid/Base Ka/b | Vapour Properties | Transport Properties | Viewing Species Properties | Species Properties Reports |
Introduction
The species properties supplied in the SysCAD.93.db3 (see Editing SysCAD Database and Species Table) can be plotted against temperature / Pressure / Mass Fraction ranges for data fitting or validation purposes.
This reporting function can export selected Species Property Data to the clipboard, where user can paste the data onto MS Excel for analysis. This is useful for fitting equations or for data validation.
Video Link
This View Species Properties video in the tutorial section shows the different ways in which you can view species properties used in a SysCAD project, including a section on Properties Reports.
Species Properties
The steps in reporting the species property data are:
- Open a SysCAD Project - using the desired database for data extraction and then:
- Select menu command Species | Properties Report to open the Copy Species Properties to Clipboard dialog box.
- OR
- Select menu command View | Species Properties to open the $SDB Access Window.
- Click on the Species Properties Reports Button to open the Copy Species Properties to Clipboard dialog box.
- Select the required data to be copied, press the Copy to Clipboard button.
- Open data analysis package such as MS Excel, then press paste.
- Use the data to generate graphs for data analysis.
Functions that can be plotted are:
- Vapour Pressure (Vp) Vs Temperature
- Vapour Temperature (Vt) Vs Pressure
- Heat of Formation (H) Vs Temperature / Pressure
- Enthalpy - Sensible Heat (Hs) Vs Temperature / Pressure
- Enthalpy - Including phase change (Hz) Vs Temperature / Pressure
- Heat Capacity (Cp) Vs Temperature / Pressure
- Entropy (S) Vs Temperature / Pressure
- Gibbs Free Energy (Gf) Vs Temperature / Pressure
- Change of Gibbs Free Energy (DeltaGf) Vs Temperature / Pressure
- Density (Rho) Vs Temperature / Pressure
- Solubility Vs Temperature / Pressure
- HeatValueHi Vs Temperature / Pressure
- HeatValueLo Vs Temperature / Pressure
- Density Correction Vs Mass Fraction
- Boiling Point Elevation (BPE) Vs Mass Fraction
- pH (negLogH) Vs Mass Fraction
- Heat of Dilution (HtDilution) Vs Temperature / Mass Fraction
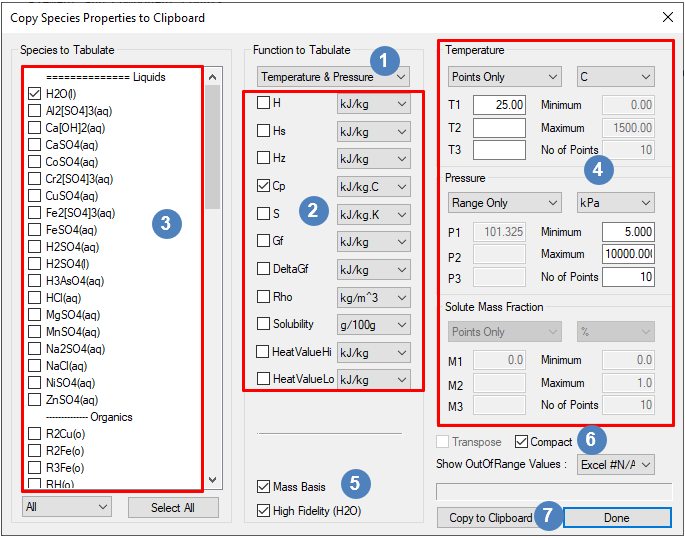
Copy Species Properties to Clipboard
The Copy Species Properties to Clipboard Dialog Box lets user select the required properties to be reported.
The options visible on this dialog box will vary depends on the options selected, the example below shows the selection of the Temperature & Pressure Function type.
