Sensitivity Analysis
Jump to navigation
Jump to search
Navigation: User Guide ➔ Getting Started ➔ Example Projects ➔ Sensitivity Analysis
| Example Reports | ||||
|---|---|---|---|---|
| Project Report | Flowsheet Report | Project Criteria Report | Sensitivity Analysis | Default Reports |
Related Links: Excel Reports
This page is for Build139 and later, for Build138 and earlier, please see Sensitivity Analysis 138.
File Location
This file is stored in ..\SysCADXXX\Examples\01 Reports\Sensitivity Analysis.xlsm
Brief Description
This is an example Excel Report using COM Automation for sensitivity analysis. It allows user to set up a large number of test cases, when the run sensitivity macro is executed, it uses COM to run through the cases without further user input.
As is, this file is used to test the sensitivities of TWO variables.
- User can define the test value range for the two variables and the number of test cases to be analysed, the macro will fill in the test case inputs based on the parameters specified.
- User can use one of the macro to run one, multiple or all the test cases.
NOTES:
- This file is currently set up to run upto 100 cases, but user can extend this value by modifying the workbook and VBA code.
- User can add in other input variables, but the input values will need to be entered manually as they are not handled by the VBA code as is.
- The case results and Graph results may need modifying if extra variables are being reported.
Worksheets
Main
- This worksheet contains instruction on how to run the analysis, please read those carefully.
- Use the "Browse Project" button or manually enter the project path (full path is required).
- User may use the "Clear All Results" macro button to clear all results on the "CaseResults" worksheet. Useful for project change, where existing results are no longer valid.
- When one of the "Run" macro (3a to 3c) is executed, it will automatically start up SysCAD, load the specified project and run the number of cases specified.
- All fields in blues with white background are user input fields.
- Before running the analysis, please make sure the User Inputs and Model outputs are set up correctly on Cases and CaseResults worksheets respectively.
Cases
- This is the Case inputs worksheet, all fields in blues with white background are user input fields.
- How to input user values For Sensitivity Analysis of two variables: (Use the Run Sensitivity Button on the Main Tab to run this)
 Define how many variations for the primary variable and enter the value in Cell C2.
 The primary variable range is entered in Cells C9 and D9.
 Base on these inputs, the VBA code will enter the values in Row 9, starting from Case 1.
 Define how many variations for the secondary variable and enter the value in Cell C3.
 The secondary variable range is entered in Cells C11 and D11.
 Base on these inputs, the VBA code will enter the values in Row 11, starting from Case 1.
 The Case1 Report is a SetTagList Report, as shown in Cell E6, the subsequent reports are SetTagListOffset reports. (The image below shows the Report for Case2)
 If user wants to use this workbook for a different project, please ensure the correct SysCAD Tags are entered cells E9 and E11. (Also change the description on cells B9 and B11 to match the tags.)
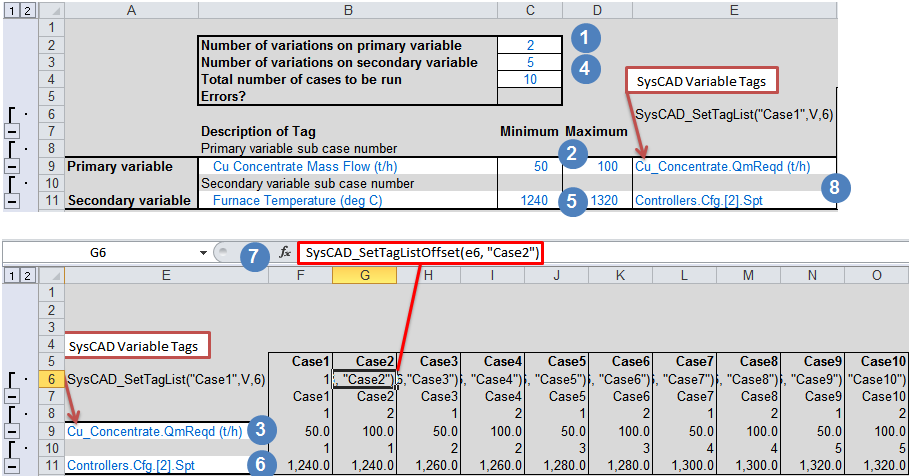

- NOTES:
- If the Case input values do not update, check the calculation options in Excel, use Calculate Now or change to calculate Automatically on change.
- User may add extra input variables to E12 (and rows below, there is no limit for this, just insert the required number of rows).
- Please adjust the "SysCAD_SetTagList" function parameters in E6 to accommodate the additional tags.
- For these additional tags, user will need to manually add the input values for each case as they will not be "auto-adjusted" by this worksheet.
- This worksheet uses conditional formatting to display "unused" cases in light grey font.
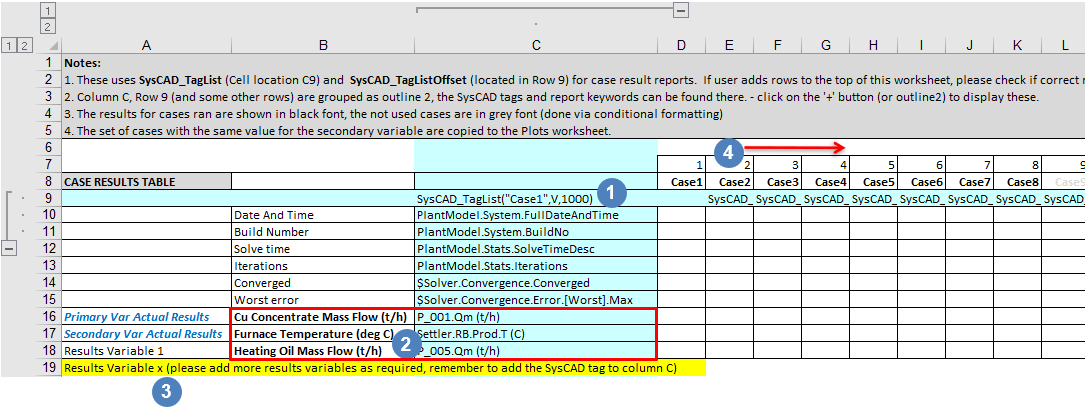
CaseResults
- This is the Case results worksheet
- SysCAD TagList report for Case1 is Column C
- User wanting to adapt this report for their use should change these SysCAD tags.
- For extra tags, just insert new rows.
- SysCAD TagList Offset report for Case2 onwards.

NOTE:
- This worksheet uses conditional formatting to display "unused" cases in light grey font.
- The results on this worksheet can be cleared by pressing the "Clear All Results" button on the "Main" worksheet.
- The "unused cases" results can be cleared by the "Clear Un-used Results" button on the "Statistics" worksheet.
Plots
- This is an optional tab, it creates graphs for the results from the CaseResults worksheet.
Statistics
- This is an optional tab, it creates statistic information for the results from the CaseResults worksheet.
- Press "Clear Un-used Results" button to make sure the calculations are performed using valid case results.