Quick View
Navigation: User Guide ➔ Edit ➔ Quick View
Related Links: Graphics Window, Access Window
Introduction
The Quick View list is used to quickly access selected unit model information from the Graphics Window.
- To display the Quick View list, left click and hold with the mouse button on the unit model of interest and a list will appear.
- The Quick View list is a Active window, i.e. it will be updated as SysCAD is solved. It is very useful to track the flow of material in the project, watch concentrations of selected species, etc.
- The quick view can be displayed for single or multiple units (of the same unit type)
- Some variations of the quick view display are explained in details in the following sections, these include:
- Temporary Quick View - Click with Left Mouse button and HOLD.
- Pinned Quick View - First Entry -
 + Left Mouse button Click
 - Pinned Quick View - Multi Entry - +
 + Left Mouse button Click
- The first row of the Quick View is always the Status indicator and shows coloured blocks with same colours as used for the model graphics symbol. The colours and different status indicators are described in General Options Colours.
- Each unit type has its own default Quick View list configuration. Most models have default lists configured. However, the user can customise these lists as described in Editing Quick View Window below.
- The Default Quick View values are stored at: ..\SysCADxxx\BaseFiles\QuickViewDefaults.ini
- The individual project Quick View information is saved at: ..\Project Name\CfgFiles\SCD_RTL.ini
Video Link
This YouTube video shows you how to display and change a Quick View window.
Editing Quick View Window
Command Path: Edit - Quick View | OR | Access window Button:![]()
Add Variables to Quick View
- Open the Access Window for the unit of interest.
- If a Variable is already on the Quick View list
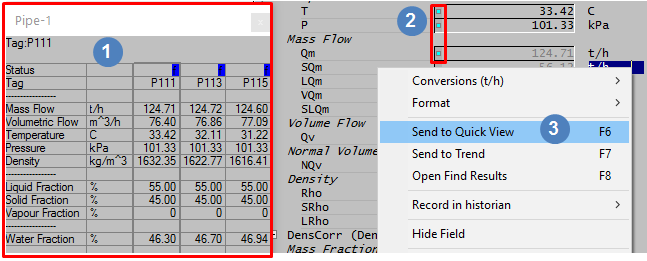
 , a small turquoise square will appear to the left of the variable name on the access window, as shown in
  .
. - To add a new variable to the quick view list, select the variable(s) you want to add to the Quick View list using the left mouse button, then right click on the variable and choose Send to Quick View (You may also use F6)
 .
.
- The selected variable(s) will be added to the Quick View editor dialog box.
- While the Quick View editor dialog box is opened, you may add more variables to the list.

Edit Variables in Quick View

Editing Panel Unit Type List Box Select the required unit type, each unit type has a predefined list of variables. Label Column This column allows the user to add a display name (Label) for the variable(Tag), double click on the Tag name on the Label column to rename it. 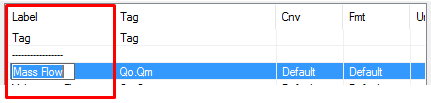
Tag Column This is the actual SysCAD variable tag, it cannot be changed. 
Cnv Column To change the Engineering units: right click on the selected variable and select Conversions from the pop up list 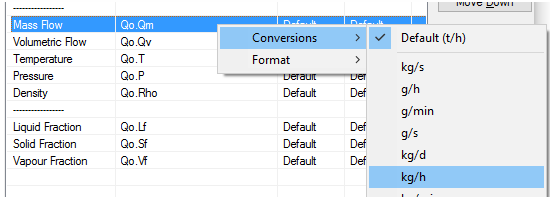

Fmt Column To change the Display number format: right click on the selected variable and select Format from the pop up list 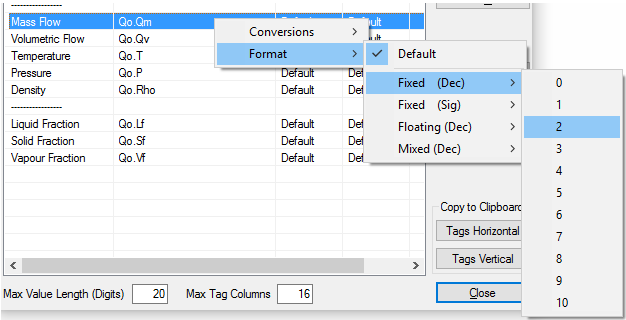
Buttons and setting option 
 and
and 
Used to position the variables in the right order 

Remove the variable from the lis 

Add a separator or text label to the list, default is '----------'. This can be edited by double clicking, e.g.: '-- Fractions --' 
Reset to Default Resets to the Default list distributed by SysCAD. All user added variables will be removed from the list. 
Copy to Clipboard Allow the user to copy the variables shown in the Quick View window and use them for an Excel report. See Data for Excel Reports below. 
Max Value Length specifies the maximum number of the quick view entries (global option, same for all unit operation types) by entering a value in the Max Value Length box. The default is 20. 
Max Tag Columns Specifies the maximum number of the columns in one quick view multi unit list. This is a global option, the default is 16. If this number is exceeded, a new Quick view list will be created) 
Close Button When finished, close the Quick View List to save it.


Note:
- Do NOT use the Qi tab when copying variables to Quick View from pipes. Most pipes are simple and do not have a Qi tab. Therefore, if the user has chosen to display a variable from the Qi tab, this will generate a warning message in SysCAD when the user clicks on a pipe to access the quick view.
Single Unit Quick View
The user may view the Quick View from the graphics window - essentially it can be considered as a mini Access Window.
The Quick View list can be accessed in either of the following ways:
Temporary Quick View
You can open a temporary Quick View list for the unit by clicking on a unit and hold down the left mouse button. The following window for a pipe will be displayed while the button is depressed. When you release the mouse button, the window will disappear.
|
|
|

Permanent (Pinned) Quick View
You can open a more permanent Quick View list for the unit by clicking on a unit with the left mouse button while holding down the Control key:
![]() + Left Mouse button Click
+ Left Mouse button Click
- This action will open the Quick View List as displayed above, but this mini window will remain visible (i.e. pinned) without the user having to hold down the left mouse button.
- While this window is open it will always be the top window, i.e. all other SysCAD windows will be displayed behind the Quick View window.
- This allows users to monitor variables or to compare units while the project is solving or stopped.
- The user may close the Quick View window by clicking on the close button (x) in the top right hand corner of the Quick View.
Multiple Units Quick View

|
The user may open a Quick View window that displays multiple units by clicking on units one at a time while holding down the Control and Shift keys:
For example: By holding down the Shift + Control Keys and then left Clicking on 3 pipes, the Quick View window (shown left) is displayed. This window is also 'Permanent' and will remain on top until the user closes it by clicking on the close button at the top right hand side. |
Display Bar Graphs
Any of the variables can be displayed visually as Bar Graphs on the Quick View window:

- Right click anywhere in the line of the required variable, for example the Temperature of any pipe
- Select 'Bar Graph Options' from the pop up menu, as shown above.
- Select either 'Bars with Zero' or 'Bars Zero Suppressed' to display the bars as shown above.
- You may then proceed to select another variable to display visually. In the example above we have displayed both Temperature and Solids Fraction.
- The colour of the bar is shown next to the relevant variable.
- To remove the bars, select 'Bars Off' from the menu.
Copy Data for Excel Reports
Please also see ETip: Quick View Excel Report Template.
The Quick View can also be used to quickly copy either:
- Lists of variables, Qo.Qm, Qo.Qv, Qo.T, etc. to Excel; or
- A table with units and variables to SysCAD.
List of Variables
- The 'Copy to Clipboard' button in the Quick View Editor window (described in Editing Quick View Window ) allows you to copy the list of variables to Excel as the basis of a report.
- This will also automatically insert a Tag_Select key word that will allow you to then generate a report for ALL units in the project.
- The Excel report shown below was generated from the Quick View editor window shown above:

Notes:
- The Labels and Separators are copied into the Excel report.
- The SysCAD_TagSelect statement is set up for the unit type in the Quick View window, in this case Pipes, or streams.
- When you generate this report from SysCAD it will report the selected variables for ALL of the pipes in the project.
- Please see SysCAD Tag Select Reports for more information on this type of report.
Table of Units and Variables

The user may quickly set up an Excel stream report for a flowsheet:
- Create a Quick View window with the pipes that you want in a report, as shown above (described in Multiple Units Quick View).
- Note: You may select units across multiple flowsheets.
- Right click anywhere in the Quick View window and select 'Copy Table to Clipboard'
- You may then select to copy the primary tags - the units, in this case pipes - either Horizontally or Vertically.
- If you select 'Tags Horizontal (No Labels)' or 'Tags Vertical (No Labels)' then the Label column (the one on the left) will not be copied.
The example below shows the table generated in Excel from the above Quick View with 'Tags Horizontal' selected:

- The Labels are copied into Column A and the conversion units into Column B. (If the 'No Labels' option is selected, neither of these columns would be copied)
- The report key word SysCAD_TagTable("",H,5,13) is automatically generated. You may insert a report name (it is not necessary).
- You may now generate a SysCAD report in Excel.
- Please see SysCAD Report in a Table for more information on Excel reports.