General Options Trends
Jump to navigation
Jump to search
Navigation: User Guide ➔ Menu Commands ➔ Tools ➔ General Options ➔ Trends
| General | Access | Find | Toolbars | Project | Graphics | Drawing | Colours | Mouse | Trends | TagList |
|---|
Trends
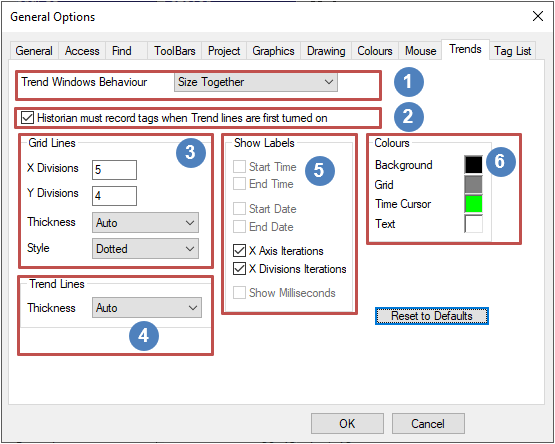
Various display and behaviour options can be configured for the Trend Window.
| Group | Option | Description | |
Trend Window Behaviour |
Separate | All Trend windows are handled separately. | |
| Size Together | All Trend windows will be sized together. | ||
| Move Together | When a Trend window is being moved, all Trend windows will be moved. | ||
| Move and Size Together | When a Trend window is size or moved, all Trend windows will be affected. | ||
| Treat as one | SysCAD will display only ONE Trend window at a time. The user may use the Explorer Window to cycle through the different trend pages. User can also use the | ||
| Historian must record tags when Trend lines are turned on | If this option is selected, when the trend line is switched on for the first time, the Historian (provided it is on) also records the tag. | ||
Grid Lines |
X Divisions | The maximum number of segments into which the X axis will be divided. The allowed section widths are hardwired as follows:
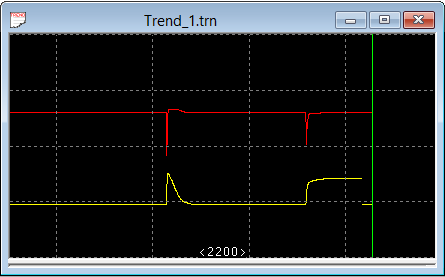
Note: Section widths will always be rounded to the nearest unit as presented above, so it is possible the number of sections shown on the trend page does not match the exact number of X divisions specified. e.g. X axis is currently 2200 Iterations with X division is set to 5, the actual number of full sections shown will be 4.4. See image to the right. |

|
| Y Divisions | The number of segments into which the Y axis is divided. This will always be exact. | ||
| Thickness | This sets the line thickness (i.e. weight, width) of grid lines. | ||
| Auto | Automatically selects line thickness based on screen DPI. | ||
| Thin / Medium / Thick | Grid lines are 1 / 2 / 3 pixel(s) thick. | ||
| Style | Solid / Dash / Dotted / etc. | This sets the visual style of the grid lines. | |
Trend Lines Available from Build 139.32925. |
Thickness | This sets the line thickness (i.e. weight, width) of trend lines. | |
| Auto | Automatically selects line thickness based on screen DPI. | ||
| Thin / Medium / Thick | Trend lines are 1 / 2 / 3 pixel(s) thick. | ||
Show Labels |
Start Time | For Dynamic Projects only. Show the Start Time at the top left of the Trend Line View. | |
| End Time | For Dynamic Projects only. Show the End Time at the top right of the Trend Line View. | ||
| Start Date | For Dynamic Projects only. Show the Start Date at the top left of the Trend Line View. | ||
| End Date | For Dynamic Projects only. Show the End Date at the top right of the Trend Line View. | ||
| X Axis Iterations / Duration | Show the total number of iterations (Steady State) or time duration (Dynamic) across the whole X axis. Displayed at the bottom of the Trend Line View. | ||
| X Divisions Iterations / Duration | Show the number of iterations (Steady State) or time duration (Dynamic) within one X axis segment. Displayed at the bottom of the Trend Line View. | ||
| Show Milliseconds | For Dynamic Projects only. The Trend Line Display area Label format. Select this to include milliseconds in time labels. | ||
Colours |
Background | The Trend Line Display area background colour. | |
| Grid | The Trend Line Display area Grid Line colour. | ||
| Time Cursor | The Trend Line Display area Current Time Line colour. This is the solid vertical time denoting the most recent time. | ||
| Text | The Trend Line Display area Text Label Colour. | ||
| Reset to Default | Pressing this button will reset all Options on the current tab to default settings. | ||
