Programmatic Model Generation
Navigation: User Guide ➔ COM Automation ➔ Python Automation ➔ Example - Programmatic Model Generation
A very powerful SysCAD COM feature is being able to generate models and graphics programmatically. This functionality is experimental, undocumented and unsupported. Use with care! In future versions this may be changed, updated, extended or removed.
In this example, we create a new project, add some unit models and connect them with links.
 import win32com.client as wc
 root  = 'C:\\SysCAD138\\Examples\\25 Gold\\'

 SysCAD = wc.DispatchEx("SysCADSimulator93.Application")
 Prj = SysCAD.CreateProject(root+'CfgFiles\\Gold Example.cfg', root+"NewProject.spf\\")
Once we have created the project, we can access some more COM objects, Nodes which will let us manipulate the underlying unit operations (including links), and Graphics, which lets us manipulate the graphics.
It is important to understand that these are separate entities: you know you can have graphics without underlying models (For example inserting a symbol), but you can also have the underlying model with no graphics. To insert unit operations and links using COM, you have to create both the underlying model, and then the associated graphics. In fact you could create a SysCAD model and not bother with the graphics at all if all you want to do is run it and generate reports.
We start by creating the models, in this case just a source and a sink:
Nodes = Prj.Solver.Nodes
Nodes.AddUnit("FeederSink", "OreFeed")
Nodes.AddUnit("FeederSink", "Product")
Nodes.AddLink("Pipe-1", "P_001", "OreFeed", "Src", "Product", "Snk")
Nodes.AddUnit has two parameters, the class name of the unit operation (which you can find by opening a unit or a link), and the tag name.
Nodes.AddLink has six parameters, the first two as before (generally Pipe-1 for a normal link). The next four are the source node, source connection, destination node and destination connection. Of course you need to have created the source and destination before you add a link. Many unit models have multiple feeds and outputs, and when you draw a model in the usual way, you specify where the link is connected at either end. So you have to do the same here. Generally you can find the connection names by looking at an existing model, but there seem to be some special cases, in particular for FeederSinks, connect to "Src" and "Snk".
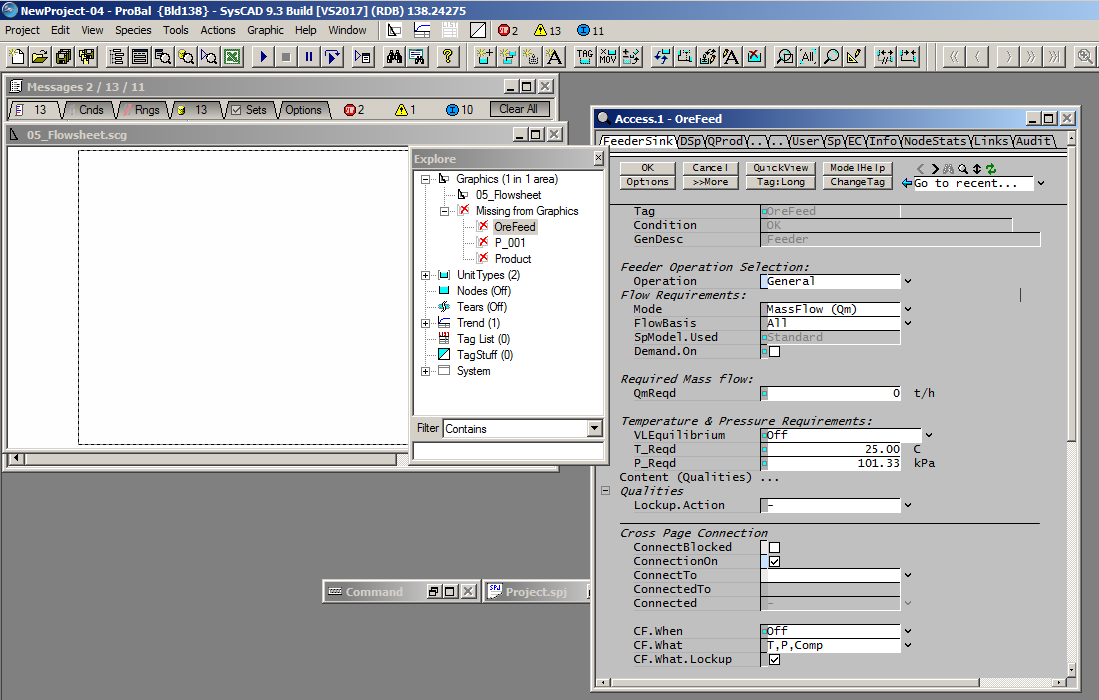
If you run the commands up to this point, you will just see an empty graphic, but the models are actually there. You can even access them via the Explore window (which tells you the models are missing from the Graphics).
So now we add the graphics. First we need to access the appropriate graphics page:
Gx = Prj.Graphics.Page("05_Flowsheet")
Add the symbols for the feeder/sinks
Gx.AddUnit("OreFeed", 100, 100, 0, "*Default*", 1, 1, 0)
Gx.AddUnit("Product", 200, 100, 0, "*Default*", 1, 1, 0)
The first parameter is the unit tag, which we already created. The next three numbers specify where the graphic is located. The first two are just X-Y coordinates, which you can see when you move the mouse around in the graphics window. (SysCAD was built with the possibility of specifying a unit location in 3D, so there is a third "Z" coordinate which is not used at the moment, so just leave it as zero)
The next parameter is the graphics symbol: you can use any of those that you see in the list when you insert a unit model, or just "*Default*" to get the default symbol. The final parameters are the X-scale, Y-scale and rotation, just as you can specify when inserting a unit. If you make these 1, 1, 0, there is no scaling or rotation.
The final job is to add the link graphics. This requires the link tag, and a list of coordinate in threes (again, XYZ, with all the Z values zero). Here we just want to draw a line from (115, 100) to (185, 100). These numbers need to be given as floats in a python list
Gx.AddLinkA("P_001", [115., 100., 0., 185., 100., 0.])
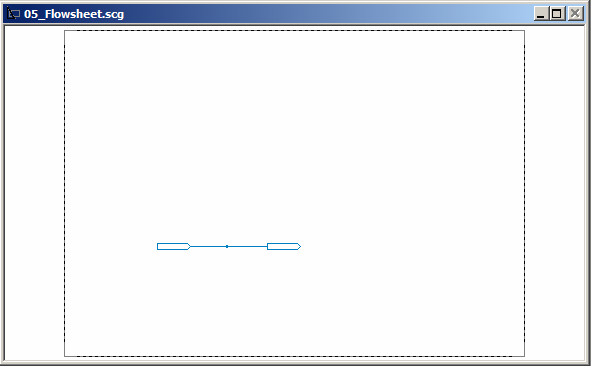
Now we have a normal looking graphics sheet with the units and link in place:
Cleaning Up
If you are playing with this interactively, it is helpful to have a function to delete all the com objects you create, you can then run this to clean up:
def clean():
   global Gx, Nodes, Prj, SysCAD.
   del(Gx)
   del(Nodes)
   del(Prj)
   del(SysCAD)
Full Code
import win32com.client as wc
root  = 'C:\\SysCAD138\\Examples\\25 Gold\\'
SysCAD = wc.DispatchEx("SysCADSimulator93.Application")
Prj = SysCAD.CreateProject(root+'CfgFiles\\Gold Example.cfg', root+"NewProject.spf\\")
Nodes = Prj.Solver.Nodes

Nodes.AddUnit("FeederSink", "OreFeed")
Nodes.AddUnit("FeederSink", "Product")
Nodes.AddLink("Pipe-1", "P_001", "OreFeed", "Src", "Product", "Snk")

Gx = Prj.Graphics.Page("05_Flowsheet")
Gx.AddUnit("OreFeed", 100, 100, 0, "*Default*", 1, 1, 0)
Gx.AddUnit("Product", 200, 100, 0, "*Default*", 1, 1, 0)
Gx.AddLinkA("P_001", [115., 100., 0., 185., 100., 0.])

def clean():
    global Gx, Nodes, Prj, SysCAD
    del(Gx)
    del(Nodes)
    del(Prj)
    del(SysCAD)
Flash Train Generation
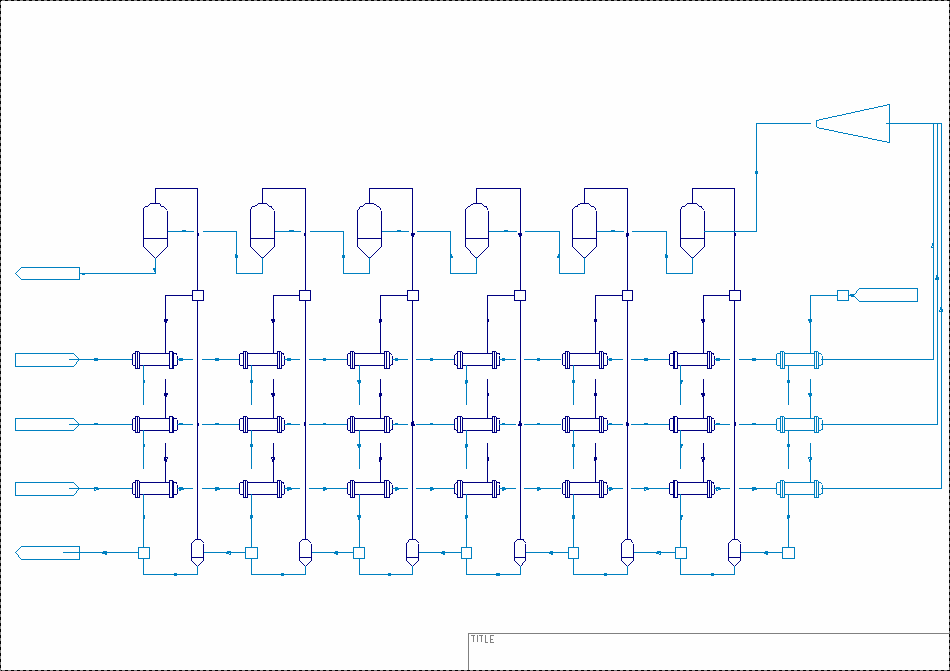
For a more elaborate example, here is a procedurally generated flash train, with a number of parallel heater rows feeding the flash tanks, and reflash of the condensate.


