Excel Reports
Navigation: User Guide ➔ Reports ➔ Excel Reports
| Excel Automation | Export Reports | Import Data | Trend Data | Information Report | |||
|---|---|---|---|---|---|---|---|
| Excel Report Summary | Adding | Executing Report | Get Tag Report | Tag Select Report | Quick View Report | Set Tag Report | Trend Report | General | Species Info |
Latest SysCAD Version: 19 March 2024 - SysCAD 9.3 Build 139.35102
Related Links: Example SysCAD Excel Reports
Introduction
Microsoft Excel has many functions and features available for presenting data in different formats. Instead of duplicating these functions, SysCAD includes the capability to communicate with Microsoft Excel. This is done in SysCAD by using COM Automation (i.e. SysCAD communicates with Excel using COM Automation).
Summary Table of Report Types and Keywords
| SysCAD Report Type and Keywords | ||||
| Type | Example Keyword (See also Keyword Syntax) | Brief Description | ||
|---|---|---|---|---|
| List | SysCAD_TagList("KPI", V, 20) | SysCAD Report in a Single Column, Hint: Use Copy Full Tag from SysCAD. This reports SysCAD values to Excel. Use this form to report a group of tags from different unit operation models, for example, the Key Process Indicators for the project. | ||
| SysCAD_TagList("KPI", H, 20) | SysCAD Report in a Single Row, Hint: Use Copy Full Tag from SysCAD. This reports SysCAD values to Excel. Use this form to report a group of tags from different unit operation models, for example, the Key Process Indicators for the project. | |||
| SysCAD_SetTagList("Criteria", V, 20) | SysCAD Set Tag Report in a Single Column. This sends values from Excel to SysCAD, best used when setting project criteria before project solve. | |||
| SysCAD_SetTagList("Criteria", H, 20) | SysCAD Set Tag Report in a Single Row. This sends values from Excel to SysCAD, best used when setting project criteria before project solve. | |||
| List with Offset |
SysCAD_TagListOffSet(B12, "Case2") | Multiple Reports from a Single Row or Column (OffSet). Please follow link for more information and example. | ||
| SysCAD_SetTagListOffSet(B22, "Case2") | Multiple SetTag Reports from a Single Row or Column (OffSet) . Please follow link for more information and examples. | |||
| Table simple |
SysCAD_TagTable("Inputs", H, 50, 50) | SysCAD Report in a Table, Hint: Use Copy Tag from SysCAD. This reports SysCAD values to Excel, the unit tags will be column headings, and variables are row headings. Best used for overall mass balance tables. | ||
| SysCAD_TagTable("Streams", V, 50, 2000) | SysCAD Report in a Table, Hint: Use Copy Tag from SysCAD. This reports SysCAD values to Excel, the unit tags will be row headings, and variables are column headings. Best used for stream data tables. | |||
| SysCAD_SetTagTable("Feed", H, 5, 50) | SysCAD Set Tag Report in a Table, Hint: Use Copy Tag from SysCAD. This sets values from Excel to SysCAD, the unit tags will be column headings, and variables are row headings. | |||
| SysCAD_SetTagTable("HX", V, 5, 20) | SysCAD Set Tag Report in a Table, Hint: Use Copy Tag from SysCAD. This sets values from Excel to SysCAD, the unit tags will be row headings, and variables are column headings. | |||
| Table Multi Column |
SysCAD_TagTable("MultiCol", H, 2, 25, 3) | SysCAD Report in Multi Column blocks, Hint: Use Copy Tag from SysCAD. This reports SysCAD values to Excel, the unit tags will be column headings, and variables are row headings. In this example, each stream has 3 columns of reported data. | ||
| Table Multi Row |
SysCAD_TagTable("MultiRow", V, 6, 3, 5) | SysCAD Report in Multi Row Blocks, Hint: Use Copy Tag from SysCAD. This reports SysCAD values to Excel, the unit tags will be row headings, and variables are column headings. In this example, each stream has 5 rows of reported data. | ||
| Table with Select Option |
SysCAD_TagSelect("Streams", V, 30, 2000, Where [UnitGroup] == "Stream", Orderby [Graphic] [Tag], ClearTags: On) | SysCAD Report in a Table based on Select criteria. Same as SysCAD_TagTable with extra options to specify selection criteria to return the list of model tags that match the select statement as well as the table data. Please follow link for more information and examples. | ||
Location of Reports
- Reports may be stored at any location.
- The default report location is \Project folder\Reports. Users can open this folder by using menu command "Project" - "Open Containing Folder" - "Reports Folder".
- Two default reports will be added to this location, please see Default Reports for more information.
- If a report is added to the Excel Automation dialogue box, and the project is saved with this information, then the report is "linked" to the project, it can be saved with the project when Project Save As or Project Save version is used.
- Other referenced files may also be added to the Excel Automation dialogue so that they are copied on save.
- Users may view all linked reports in a project and their locations by accessing the Project Window dialogue box.
Example SysCAD Reports
- As part of the SysCAD install, some Example SysCAD Excel Reports are included. Please find these stored in the \SysCADxxx\Examples\01 Example Reports folder.
- Default Reports
- For every project, the first time the Excel automation command is accessed, two reports will be added automatically to the project\Reports folder:
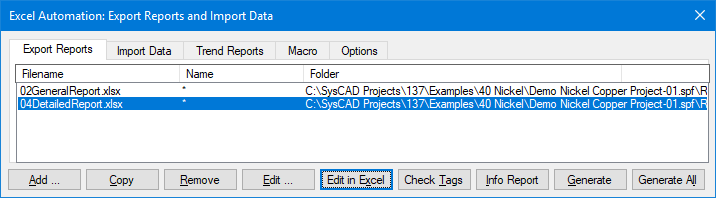
- 02GeneralReport.xlsx, (created using the SteadyStateGeneral.xlsx template).
- 04DetailedReport.xlsx, (created using the SteadyStateDetailed.xlsx template).

- These reports are set up to run with most projects. Please see Default Reports for more information.
Video Links
There are a number of videos in the Tutorial section of the Help documentation that show users how to create, link to and generate or process Excel reports. Please see Introductory Tutorial - Excel Reports and Quickview.
Obtaining Equipment & Pipe List for the Report Generation
When generating the reports, although it is possible to manually enter unit operation or pipe names into the reports, it is much easier to auto generate these lists from SysCAD.
There are a number of ways in which the user can get the lists generated:
- To obtain a complete equipment list for the project, from the Explorer Window in SysCAD, right click on the word Graphics(xx), and choose the Copy Graphics, Tag List to Clipboard option, then paste them into MS Excel.
- To obtain an equipment list for a selected graphics page, from the Explorer Window in SysCAD, open the Graphics(xx) tree, right click on the required graphics page and choose the Copy Tag List to Clipboard option, then paste them into MS Excel.
- To obtain an equipment list for a selected process unit type, from the Explorer Window in SysCAD, open the Classes Tree, right click on the required equipment type and choose the Copy Tag List to Clipboard option, then paste them into MS Excel.
- To obtain an equipment list for a selected process unit type, while also reporting the graphics page information, for example all pipes, assuming all the pipes are named with prefix P_, type the identifier P_ into the Filter box on the Explorer window, then follow point (1) above.
- To obtain an equipment list for a selected graphics page, for example all pipes for Graphics page Leach, assuming all the pipes are named with prefix P_, type the identifier P_ into the Filter box on the Explorer window, then follow point (2) above.
- To get a list by manual selection from a graphics page, see Quick View
- Use the SysCAD_TagSelect keyword option and enter the required criteria. See SysCAD Tag Select Reports for more information.
- Running the General Information Report, this report will create equipment / pipe lists for easy report generation. (This is the old method, Method 1 is now the preferred option.)
Automatically Generate Report Template from Quick View
The user may use the Quick View window to automatically generate a template for either of the following types of reports:
- A 'Tag Select' report with all of the required secondary tags (e.g. Qo.Qm, Qo.Qv, Qo.To, etc.) with the required tag select statement to generate a report for ALL units in a project.
- A Table report for selected units or primary tags (e.g. P_001, P_002, etc.) and variables or secondary tags (e.g. Qo.Qm, Qo.Qv, Qo.To, etc.).
Please see Data for Excel Reports in Quick View for more details.
Starting and running SysCAD from MS Excel
A macro can be set up in MS Excel to start SysCAD. A command script file can be included in the macro to perform various commands in SysCAD. An example of the macro is given below.
Sub StartSysCAD()
	Application.Save
	RetVal = Shell("c:\SysCAD139\bin\syscad93.exe 'c:\SysCAD138\Examples\03UnitModels\Counter Current Washer Example.spf\CommandScripts\UsingExcelReport.ssc'", 1)
End Sub
NOTE: If the user has a programming background, they can set up visual basic code to drive SysCAD entirely from MS Excel if required. For example, this may be useful if the user is in the feasibility study phase where the SysCAD flowsheet can remain untouched and many sets of test cases need to be performed.
Example Excel report with the above macro can be found in distributed projects:
- SysCADxxx\Examples\01 Reports\Project Report.xlsm (This example was created for the \Examples\40 Nickel\Demo Nickel Copper Project.spf)
- General Projects: Counter Current Washer Project - CCD.xlsm
- Alumina Project: Digestion Example - Digestion.xlsm.
The macro contained in these workbooks allows the user to modify and create a simple command script file, then SysCAD can be started and the generated command script file is executed.
Alternatively, rather than using the Shell command and Command Scripts, SysCAD can be manipulated grammatically using the full SysCAD COM API, an example excel file is distributed with the standard install.
Location of the file is:
- ..\SysCADxxx\Examples\01Reports\Sensitivity Analysis(SysCAD9.3).xlsm
For further information, please see COM Automation.