Boiling Point Elevation Discussion
Navigation: User Guide -> Boiling Point Elevation -> Boiling Point Elevation Discussion
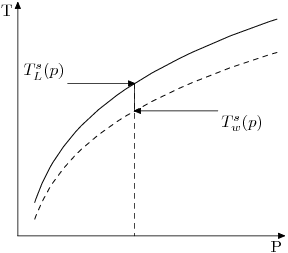
If we plot the curves for both pure water (dashed) and a liquid containing impurities (such as salt water or Bayer Liquor), we find the latter has moved up at any point. The difference between these two curves is the Boiling Point Elevation (BPE) at that particular pressure.
Note that according to this definition, [math]\displaystyle{ \beta }[/math] is intrinsically a function of pressure. Formally
- [math]\displaystyle{ \beta = T_L^{s}(p) - T_w^{s}(p) }[/math]
where:
- [math]\displaystyle{ T_w^{s}(p) }[/math] is the boiling point of water expressed as a function of pressure,
- [math]\displaystyle{ T_{L}^{s}(p) }[/math] is the boiling point for any liquor.
We have a number of possible ways of interpreting BPE:
BPE at Stream Pressure
The BPE at stream pressure is difference between the temperature at which the liquor would boil and that which water would boil at, at the stream pressure.
BPE at Stream Temperature
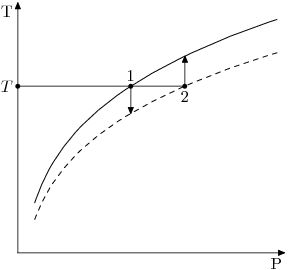
Care must be taken if the boiling point elevation is specified as a function of temperature - Does the correlation refer to the liquor boiling temperature or water boiling temperature?
See the graph below:
The BPE at stream temperature can be interpreted in two ways:
- We can choose the liquor vapour pressure at that temperature as the basis for saturation (point 1 in the above diagram); or
- We can choose the water vapour pressure at that temperature as the basis for saturation (point 2 in the above diagram).
Please see Boiling Point Elevation for a description of the Boiling Point Elevation equation used in the Standard Species model in SysCAD.

