Bivariate Statistics
Navigation: Models ➔ Statistical Models ➔ Bivariate Statistics
| Flow Statistics | General Statistics | Single Variable Histogram | Bivariate Statistics |
|---|
General Description
This model is used in Dynamic Simulation only.
The Bivariate Statistics model can be used to calculate and display statistical information about two variables and their correlation.
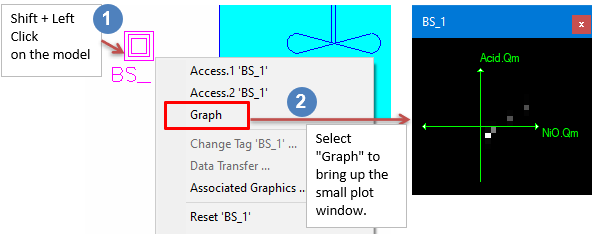
- The bivariate statistics graphic can be displayed by holding down the shift key and left mouse clicking on the Bivariate Statistics graphical symbol.
- From the menu, select "Graph" and place on the flowsheet.
Data Sections
The default sections and variable names are described in detail in the following tables. The default Bivariate Statistics access window consists of 2 sections. This number may increase or decrease, based on user configuration.
Summary of Data Sections
- BivariateStats tab - Contains general information relating to the unit.
- Info tab - Contains general settings for the unit and allows the user to include documentation about the unit and create Hyperlinks to external documents.
Bivariate Statistics Page
Unit Type: BivariateStats - The first tab page in the access window will have this name.
| Tag (Long/Short) | Input / Calc | Description/Calculated Variables / Options |
| Tag | Display | This name tag may be modified with the change tag option. |
| Condition | Display | OK if no errors/warnings, otherwise lists errors/warnings. |
| ConditionCount | Display | The current number of errors/warnings. If condition is OK, returns 0. |
| GeneralDescription / GenDesc | Display | This is an automatically generated description for the unit. If the user has entered text in the 'EqpDesc' field on the Info tab (see below), this will be displayed here. If this field is blank, then SysCAD will display the UnitType or SubClass. |
| Requirements | ||
| On | Tick box | When ticked, the model will log data and perform calculations. |
| StatTag1 | Input | The first tag which will be logged, Variable 1. This will be graphed on the x-axis and calculations performed on its values. |
| StatTag2 | Input | The second tag which will be logged, Variable 2. This will graphed on the y-axis and calculations performed on its values. |
| Reset | Button | This will reset the calculations and graph. |
| Auto_Reset | Tick box | If ticked, the calculations and graph will be reset at the beginning of every model run. |
| Graph_x_Minimum / GraphMinx | Input | The minimum value to be shown on the x-axis of the graph. Any values lower than this will not be shown on the graph. |
| Graph_x_Maximum / GraphMaxx | Input | The maximum value to be shown on the x-axis of the graph. Any values higher than this will not be shown on the graph. |
| Graph_x_Minimum / GraphMiny | Input | The minimum value to be shown on the y-axis of the graph. Any values lower than this will not be shown on the graph. |
| Graph_y_Maximum / GraphMaxy | Input | The maximum value to be shown on the y-axis of the graph. Any values higher than this will not be shown on the graph. |
| Correlation / Corr | Calc | The calculated correlation between the two tags StatTag1 and StatTag2. A value of 1 means they are perfectly correlated. |
| Variable 1 | ||
| Value1 / Val1 | Calc | The current value of Variable 1 (StatTag1). |
| Average1 / Avg1 | Calc | The average of the logged values of Variable 1 since the model was last reset. |
| StandardDeviation1 / StdDev1 | Calc | The standard deviation of the logged values of Variable 1 since the model was last reset. |
| Minimum1 / Min1 | Output | The minimum value of Variable 1 since the model was last reset. |
| Maximum1 / Max1 | Output | The maximum value of Variable 1 since the model was last reset. |
| Variable 2 | ||
| Value2 / Val2 | Calc | The current value of Variable 2 (StatTag2). |
| Average2 / Avg2 | Calc | The average of the logged values of Variable 2 since the model was last reset. |
| StandardDeviation2 / StdDev2 | Calc | The standard deviation of the logged values of Variable 2 since the model was last reset. |
| Minimum2 / Min2 | Output | The minimum value of Variable 2 since the model was last reset. |
| Maximum2 / Max2 | Output | The maximum value of Variable 2 since the model was last reset. |
| Number_of_Records / N | Output | The number of pairs of values logged since the model was last reset. |
Adding this Model to a Project
Add to Configuration File
Sort either by DLL or Group:
| DLL: | ControlDyn.dll |
→ | Units/Links | → | Statistics: Bivariate Statistics | |
| or | Group: | General |
→ | Units/Links | → | Statistics: Bivariate Statistics |
See Model Selection for more information on adding models to the configuration file.
Insert into Project Flowsheet
| Insert Unit | → | Statistics | → | Bivariate Statistics |
See Insert Unit for general information on inserting units.
